This diary has extensive and careful analysis. It is a lot to slog through. So a short summary is this:
The analyses you have seen that claim that Clinton won the Latino vote in Nevada 60-40 are misleading and based on sloppy and incomplete analysis of precinct results. They focus selectively only on a certain set of precincts in Nevada in East Las Vegas that are most favorable to Clinton. Only about 17% of Latino voters in Nevada live in those precincts. But if you also look at other precincts that are heavily Latino across other parts of Las Vegas and in Reno, you can see that Sanders did much better there.
Now on to the meat and potatoes
A bit of a controversy has broken out about the Hispanic/Latino vote in Nevada. Entrance polls show Bernie Sanders winning Latinos 53-45. But skeptics have pointed to partial precinct results from East Las Vegas to argue that Sanders did not in fact win the Latino vote in Nevada.
More thorough analysis of more complete results shows that the skeptics have jumped the gun. While it is indeed possible that Clinton at least narrowly won the Latino vote in Nevada, the conclusion that Clinton won a strong majority of the Latino vote is not supported by the data.
The skeptics do have a point — it does make sense to look at precinct results to check the plausibility of exit polls. As the votes came in, exit poll skeptics pointed in particular to results in heavily Hispanic precincts in east Las Vegas. The most forceful skeptics argued that this shows that exit polls were not just a bit off, but were way off — and that Clinton actually won Hispanics by 20% or more.
However, claims made by entrance poll skeptics that Latinos voted strongly for Clinton break down when you look more carefully and comprehensively at the results in heavily Latino precincts across the entirety of Nevada.
The bottom line conclusion after looking a bit more carefully at more complete precinct results is that the Latino vote in Nevada was generally competitive between Clinton and Sanders — much more so than the African American vote. It is indeed quite possible (and maybe even more probable than not) that Clinton won the Latino vote in Nevada by something relatively narrow, like 5 or maybe 10 points. And it is in fact very much possible that contra the limited preliminary returns from East Las Vegas, Sanders did win Latino voters in Nevada (though more likely by a bit less than 53-45).
Moreover, if you apply the same methodology of looking at precinct results as a check on exit polls and applying that to Iowa, you find that Sanders did well among Hispanics/Latinos there, and probably won them.
The Entrance Polls
Initial waves of Nevada entrance polls showed Sanders leading Clinton by a bit more than 10% among Latinos in Nevada. As additional waves of exit polls came in, Sanders’ lead narrowed a bit, but remained substantial (53-45):
 Final Nevada 2016 Democratic Primary Entrance Polls by Race
The Skeptics’ Case Against Entrance Polls
The general case against treating exit (entrance) polls as gospel is solid. Exit (entrance) polls are subject to significant sampling bias. They are conducted by interviewing large numbers of people in a relatively small stratified sample of precincts across a state. While exit pollsters try to ensure that their precinct samples are representative of the state as a whole, this does not always work perfectly. In particular, this can be a problem for estimating the Hispanic/Latino vote, as Latino decisions explains in greater detail.
A pretty good way to check the validity of exit polls is to compare them to the actual precinct level results. With that in mind, many people looked at results from east Las Vegas as results were coming in on election night. Light blue precincts voted for Clinton, dark blue precincts voted for Sanders, yellow precincts were ties, and white precincts did not have results yet at the time they took screenshots. Here are a few of many examples:
The Clinton campaign's press secretary, Brian Fallon, was only too happy to jump on this:
Clearly, the Clinton campaign would very much like for everyone to accept these numbers at face value, and would like us to accept the idea that they prove that entrance polls were wrong.
Should we? Did in fact Clinton win Hispanics in Nevada, and if so, did she win them by 60-40 or more?
Initially, I did take this basically at face value, and published a correction to a previous post I had (saying that it appeared that Clinton most likely won the Latino vote). Now, after looking more carefully, I am not so sure. It is possible that she did, but there is also a strong case to be made that Sanders won the Latino vote, based on precinct level results.
Curiously, just before publishing this, I found out that the Clinton campaign's press secretary (Brian Fallon) re-tweeted something that proves my point. They are only focusing on East Las Vegas. Notice that they are highlighting an area that corresponds very closely with my Area 1 below. They are focusing only on that, and ignoring all of the available data on the Latino vote in other parts of Las Vegas (that you can see on their own map!!!) and are ignoring the Latino vote in other places such as Reno.
Now the New York Times is blindly repeating this as well, neglecting to check how heavily Latino precincts elsewhere in Clark County and Washoe County voted.
A Prelude: Iowa
The general case against exit/entrance polls is legitimate. However, if you are going to look at precinct results as a check on exit/entrance polls, you should do so consistently, across states and across different areas within states. That is to say, don't only look at East Las Vegas and ignore everywhere else. If you look at precinct results in Iowa the same way that exit poll skeptics are looking at precinct results in Nevada, you will find that Hispanics in Iowa probably voted for Sanders:
 2016 Iowa Caucus Results for Precincts with Significant Minority Populations
And if you look at that statistically a bit more carefully, Sanders may have won Hispanics in those Iowa precincts by as much as 2 to 1 (though I would guess it was actually more narrow):
 Estimated vote by race in Iowa’s most heavily non-white precincts, calculated using the statistical method of Ecological Inference
Back to Nevada
We can look at the Hispanic population share in different precincts (in 2010, which will be a bit higher now) using Dave's Redistricting App.
Clark County (Las Vegas)
First, here is a map with streets visible, so you can orient yourself to where we are looking at:
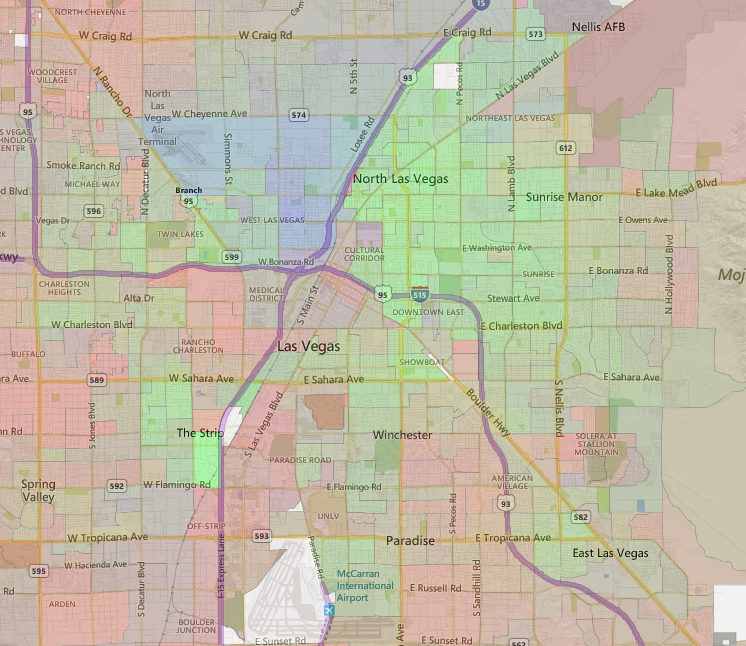 Las Vegas Map
Second, here is the same area but without streets visible. Precincts that are heavily African American are colored in blue. Hispanic = green, African American = blue, White = red, Asian = brown. Precincts which have high numbers of multiple races are colored in between those.
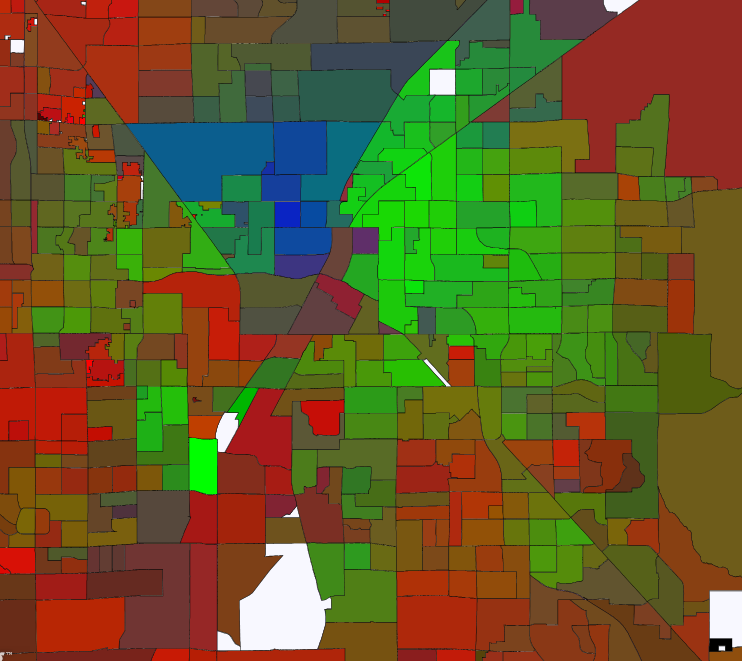 Las Vegas Map. Hispanic = green, African American = blue, White = red, Asian = brown.
Now let’s compare this to the precinct level results in Las Vegas. Light blue precincts were won by Clinton, dark blue precincts were won by Sanders. Beige/yellow precincts were ties, and white colored precincts still didn't have results when I took this screenshot.
Now, what I also did was take circle the most heavily Hispanic areas of Las Vegas in Green, and number them. I also circled the most heavily African American part of Las Vegas in yellow (area #10).
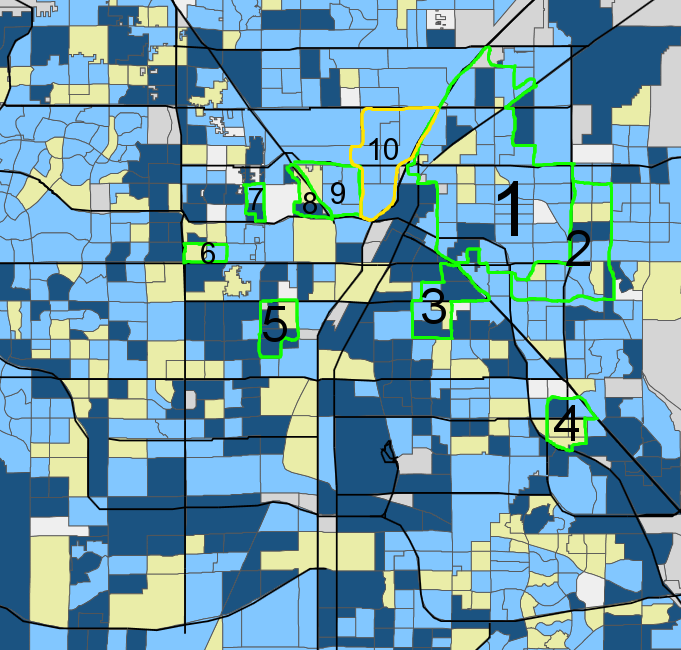 Las Vegas Precinct results map.
Just from eyeballing this map, you can notice a few things.
-
The part of Las Vegas that exit poll skeptics have been focusing on is east Las Vegas — areas 1 and 2 on the map above. This is indeed the most heavily Latino area of Las Vegas, so it does make sense to look at the results there. While Sanders did win some precincts in these areas, and while there were a number of other precincts here that were ties, you can clearly see that Clinton won the bulk of the precincts in this heavily Latino part of East Las Vegas. But you can also see that Sanders did manage to win or tie in some of those precincts — and even in a few of the most heavily Latino of those precincts.
-
However, what entrance poll skeptics and the Clinton campaign's press team have not been focusing on are any of the other other heavily Latino precincts. You won't see any tweets with screenshots from those precincts. So take a careful look at areas 3, 4, 5, 6, 7, and 8 (all bordered in green). Area 9 is a mixed Hispanic/African American neighborhood that Clinton won on the strength of her African American support (we'll come to that). Compare them to the demographic map of Las Vegas above from Dave's redistricting App to confirm to yourself that those indeed are heavily Latino areas. And then look at the results. What you can clearly see is that Bernie Sanders won a lot of those precincts. A lot of them were also ties. And a pretty good number of them were also won by Clinton. Now, precinct lines are constantly being redrawn. The up to date precincts for which we have elections data do not match perfectly with the 2010 Census precincts for which we have demographic data. But counting overlaps, I can count that 9 of those precincts voted for Sanders, 5 voted for Clinton, and 8 were ties.
- So on a first visual pass, it looks like Clinton won most of the heavily Latino parts of East Las Vegas. But as for the heavily Latino parts of other parts of Las Vegas… That's not so clear… at all...
Washoe County (Reno)
OK, now let's do the same thing for Nevada's other major city, Reno. First, here’s a map with roads to orient yourself:
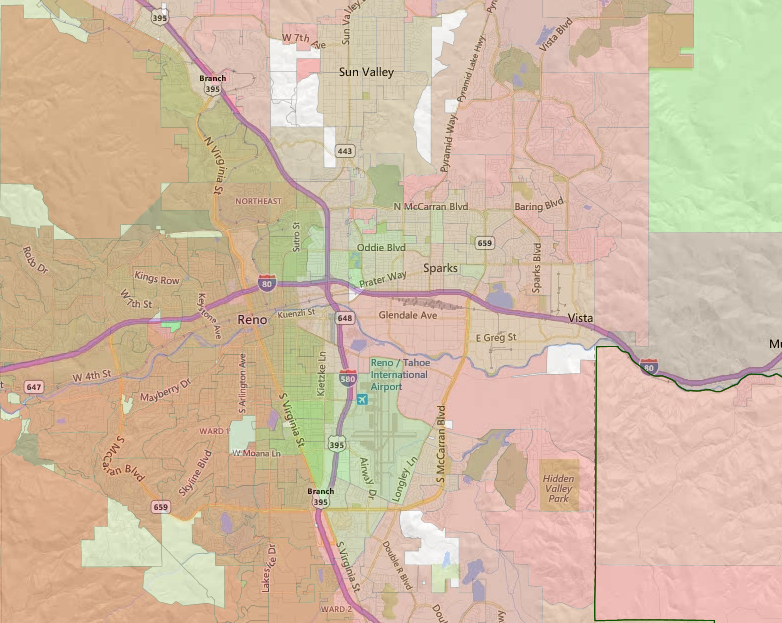 Reno map
Second, here is the same area but without streets visible. Precincts that are heavily African American are colored in blue. Hispanic = green, African American = blue, White = red, Asian = brown. Precincts which have high numbers of multiple races are colored in between those:
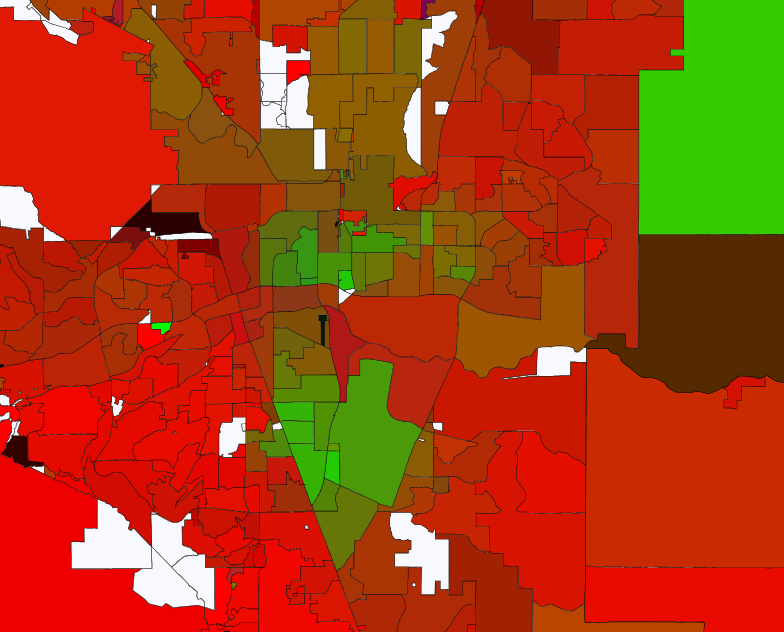 Reno Map. Hispanic = green, African American = blue, White = red, Asian = brown.
And third, here are the caucus results. Light blue precincts were won by Clinton, dark blue precincts were won by Sanders. Beige/yellow precincts were ties, and white colored precincts still didn't have results when I took this screenshot.
The Hispanic population in Reno is smaller than in Las Vegas, but there are nonetheless two heavily Hispanic neighborhoods. Again, I circled and numbered those areas of Las Vegas in green:
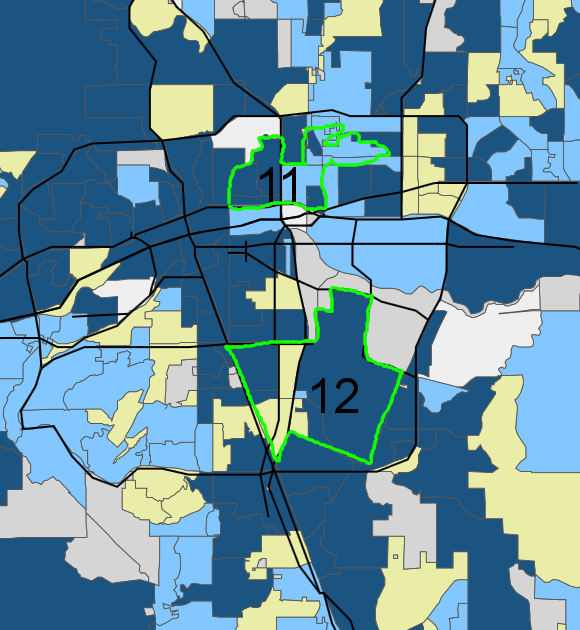
Again, let's quickly eyeball it to start with:
- In area 11, it looks like Clinton and Sanders both won some precincts.
- In area 12, the bulk of the precincts were won by Sanders or tied, and Clinton won a small precinct.
Now let’s look at it a bit more systematically, with numbers
Here is 2010 census data on the voting age population in each of these 12 areas that we circled (taken from Dave's Redistricting App). Statewide data is at the top, data for each of the areas is listed, and data for all of the rest of the state that is not in one of those 12 areas is listed under "Other.”:
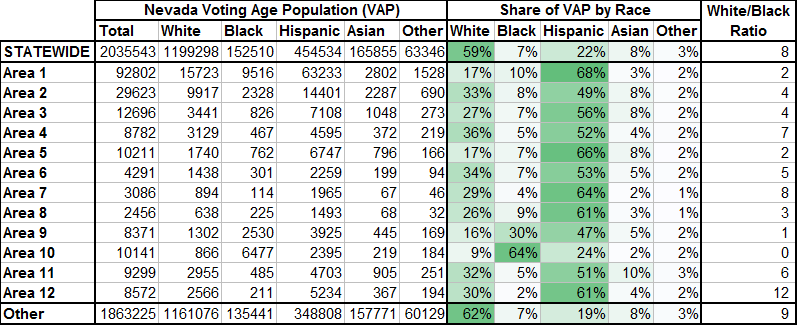 Voting Age population in Nevada (2010 Census). Of course, the Hispanic population has only gone up since then, so these figures are understatements.
From the VAP data, we can confirm that each of these areas is indeed fairly heavily Hispanic. The exception is Area 10 (and to some degree 9), which we picked out in order to be able to compare heavily African American areas with heavily Hispanic areas. There are some other things worth noting:
- Only 77,634 of Nevada's 454,534 voting age Hispanics (only 17%) live in the heavily Latino part of East Las Vegas encompassed in Area 1 and Area 2.
- Particularly in East Las Vega (Areas 1 and 2), while the absolute level of the African American populations are not larger, there is a much lower ratio of Whites to African Americans than in Nevada as a whole (also in Areas 10 and 11 in heavily African American North Las Vegas). As we will see, this is important.
But the VAP is not fully reflective of the electorate. Hispanic turnout tends to be lower than that of the overall VAP. To approximate actual turnout we can turn to… exit polls. True, exit polls can incorrectly estimate the share of the electorate that is in a demographic category just as they can incorrectly estimate who that demographic supported. But it is easier for exit polls to accurately gauge turnout by race than it is to gauge how people of each racial group voted.
As a first approximation (which is not strictly true), we can assume that people across the state turned out at uniform rates for each racial group. If we do that, the approximate makeup of caucusgoers is this:
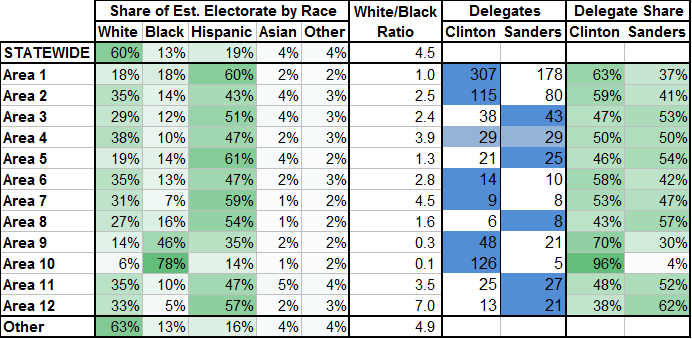
This causes the Hispanic share to go down a bit, but the estimated Hispanic electorate remains at, near, or above a majority in each of these areas except for 9 and 10 (which highlight African Americans, not Hispanics).
- The other thing it does is it causes the African American share to go up significantly. In Democratic primaries, African Americans "punch above their weight,” especially in areas with large, relatively low-turnout Hispanic populations. And since there is no dispute that African Americans heavily favored Clinton in Nevada, that means that a substantial portion of Clinton's victory margin in those precincts probably actually came from African Americans rather than from Hispanics. You can also see that the ratio of whites to blacks goes down. In Area 1, for example, there were probably just as many African American caucusgoers as there were white caucusgoers. And if those African American caucusgoers were voting heavily for Clinton while those white caucusgoers were splitting fairly evenly between Clinton and Sanders, that is enough to have a large impact on the delegate results.
- From those delegate results, we can see that indeed, Clinton did very well in East Las Vegas (areas 1 and 2), where she won about 63% and 59% of the delegates, respectively. That is very much in line with the observations of entrance poll skeptics we noted above.
- But we can also see that the same is not true of the other heavily Latino areas of Nevada, outside of East Las Vegas. Sanders actually won in most (though not all) of those areas.
We can (approximately) quantify the contribution made by African Americans to Clinton's lead in each of these areas:
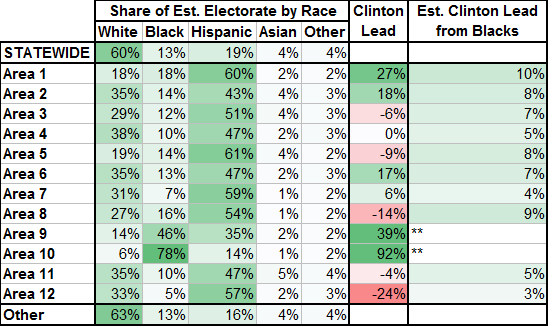
For example, Clinton won in Area 1 by 27%. That looks like a landslide among Hispanics for Clinton, at least if you don't look too closely. But if African Americans made up about 18% of the caucusgoers there, and if they voted (as exit polls say) about 76-22 (77-23) for Clinton, then African Americans alone were responsible for a 10% Clinton lead in Area 1 of East Las Vegas. Even if the other 82% of caucusgoers had split exactly evenly, Clinton would have won there by 10, just from African Americans! In other words, when people look at some of these heavily Hispanic precincts and see that Clinton won by large margins, a significant part of those large margins actually comes from African Americans — not Hispanics.
It is possible that African Americans may have supported Clinton more strongly than that. If so, then that means that Sanders probably did a bit better among Hispanics. On the other hand, if African Americans supported Clinton less strongly than 77-23, then that means that Sanders made more inroads with African Americans than exit polls say. So I am not sure which of those 2 possible errors would be better for Clinton or better for Sanders. Pick your poison. It is also possible that African American turnout may have been a bit lower or a bit higher than that (there's no way to tell).
In the various other areas, you can also see pretty clearly that if African Americans were largely backing Clinton, they were responsible for substantial proportions of Clinton's lead.
In area 10 in particular, it is very clear that Clinton won overwhelming support from African Americans. She won by 92%, with a caucus electorate that was probably about 78% African American. The reason she was able to do win by so much there was by holding Sanders under 15%. That meant that in many of those precincts, Sanders was not viable and Clinton won all of the delegates. Sanders probably didn't have literally 0 supporters in those precincts, but he was below viability. But just as Hispanics who live in less heavily Hispanic areas may vote differently than Hispanics who live in heavily Hispanic areas, the same is true for African Americans. So the fact that Clinton won African Americans by so much in Area 10 of North Las Vegas does not mean that she won African Americans by that much everywhere. Voting patterns are different in more homogeneous areas. Especially in caucuses, when you live in a homogeneous area, there is greater social pressure and a tendency to conform and vote the same way as others.
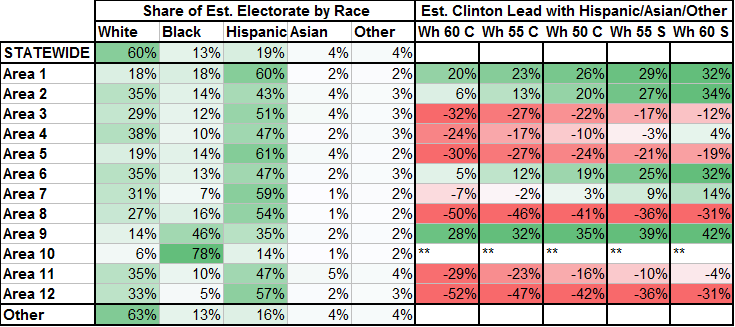
So what does this mean for how Latinos voted? The chart below displays 5 scenarios, all of which assume that African Americans voted 77-23 for Clinton (as exit polls say):
-
Scenario Wh 60 C: If whites voted 60-40 for Clinton, then Clinton must have won Hispanics, Asians, and Other race voters in those precincts by about the numbers shown — for example, she would have won Hispanics, Asians, and Other race in Area 1 by about 20%.
-
Scenario Wh 55 C: Shows the implied Clinton lead among Hispanics, Asians, and Other race voters if whites voted 55-45 for Clinton.
-
Scenario Wh 50 C: Shows the implied Clinton lead among Hispanics, Asians, and Other race voters if whites split 50-50 between Clinton and Sanders.
-
Scenario Wh 55 S: Shows the implied Clinton lead among Hispanics, Asians, and Other race voters if whites voted 55-45 for Sanders.
-
Scenario Wh 55 S: Shows the implied Clinton lead among Hispanics, Asians, and Other race voters if whites voted 60-40 for Sanders.
What can we conclude from this?:
- Under all plausible scenarios, Clinton won by pretty large margins with Hispanics in East Las Vegas (roughly 26% in Area 1 and 20% in the less heavily Hispanic Area 2).
- But Clinton does not seem to have done the same outside of Areas 1 and 2. In fact, she is more likely to have lost Hispanics by similar margins (by around 22% in Area 3, 10% in Area 4, 24% in Area 5, 41% in Area 8, 16% in Area 11, and 42% in Area 12. Areas 7, and especially 6, were better for her, but those seem to be the exception. There is also Area 9. But my own guess is that in fact African Americans there probably voted for Clinton more strongly than 77-23 (similarly to in Area 10), which would mean Hispanics were more competitive there. You be the judge on that. We won't speculate about Area 51.
- Even if we assume that for some unknown reason white voters in these areas very strongly backed Sanders (by something like 60-40), Clinton wouldn't be likely to have won Hispanics outside of East Las Vegas (and in the 6 Casino polling places, where a different dynamic took over with the Culinary union). But it's not really plausible that Whites in those precincts would have backed Sanders much more strongly in those precincts than elsewhere. If you just look at the precinct maps, you can see that there are lots of much more heavily white precincts nearby all of these areas which voted for Clinton.
So the most plausible explanation of the data we observe seems to me to be this:
- Clinton won by large margins in heavily Latino parts of East Las Vegas (Areas 1 and 2) because she won Hispanic (and African American) voters who live there by large margins.
- Clinton won the heavily African American parts of North Las Vegas (Area 10) due to very strong support from African Americans in heavily African American precincts. She won in Area 9 by large but smaller margins due to some combination of support from African Americans and Hispanics.
- Clinton did not win the heavily Latino parts of Nevada outside of East Las Vegas (Areas 3, 4, 5, 6, 7, 8, 11, 12). Instead, these areas were generally competitive, and Sanders actually seems to have won them. The most likely explanation for that is that Sanders probably won Hispanics in those areas.
- If that is not the case, then we need an explanation as to how Sanders managed to do so well in so many heavily Hispanic precincts. And in many other heavily non-white precincts which you can spot just by taking some time and looking through the precinct results map, and comparing it to a demographic map.
There’s a key tidbit buried at the bottom of Nate Cohn's recent article about this:
A Democratic pollster unaffiliated with either campaign said that Mr. Sanders does better among nonwhite voters in areas where whites represent a larger share of the population, which would suggest that a precinct-based analysis would understate Mr. Sanders’s strength.
And that is pretty much exactly what we have seen. We found other areas in Nevada that are heavily Hispanic, but are not in the particularly heavily Hispanic part of East Las Vegas. Although those precincts themselves are heavily Hispanic, they are in much smaller densely Hispanic neighborhoods — and they are generally surrounded by more other people who are not Hispanic. The voters who live there live in less homogeneously Hispanic environments. If even Hispanic voters who live in those precincts seem not to have voted the same way as Hispanic voters in heavily Latino parts of East Las Vegas, then the same is most likely true of Hispanics who live across other parts of Nevada.
The same, incidentally, is true of Hispanics in Iowa, where Sanders also appears to have done very well.
So now let's go back and re-consider some very important facts.
- Only 77,634 of Nevada's 454,534 voting age Hispanics (only 17%) live in the heavily Latino part of East Las Vegas encompassed in Area 1 and Area 2.
- Another 40,424 of Nevada's 454,534 voting age Hispanics (9%) live in heavily Latino precincts that are not in East Las Vegas, but are rather scattered around other parts of Las Vegas or in Reno (Areas 3 through 12).
- The remaining 348,808 of Nevada's 454,534 voting age Hispanics, and the vast majority (77%) live in precincts that are much less heavily Hispanic than Areas 3 through 12.
So what is more likely?
- Those 77% of Latinos who live in less heavily Hispanic precincts across Nevada voted more similarly to Area 1 and 2 of East Las Vegas — fairly strongly for Clinton (by 20% or so, let's say).
- Those 77% of Latinos who live in less heavily Hispanic precincts across Nevada voted more similarly to Latinos in Area 3-12 — competitively splitting their vote between Sanders and Clinton, possibly favoring Sanders slightly, and possibly favoring Clinton slightly.
To me, option #2 seems more likely.
Anyone who doubts that must provide an answer to this question:
Why did Sanders do so well in so many of Nevada's heavily Hispanic precincts that are not located in East Las Vegas? If he didn't get significant support from Hispanics there, how did that happen?
That doesn't mean that exit polls are perfect or cannot be wrong. They can be, as I have said before. I do not dismiss the possibility that Clinton could have won Hispanics in Nevada. Indeed, Clinton may have won Latinos by 5%, or even 10%. Or Sanders may have won them by 5%. But it is unlikely that Clinton won them by anything like 20%.
You cannot objectively look at this data and conclude that Clinton strongly won Latinos in Nevada. The only way you can do that is by selectively looking at the data — concentrating only on results from a small area in which only about 17% of Nevada’s Hispanic VAP lives (Areas 1 and 2 of East Las Vegas) and ignoring the other 83% of Nevada’s Latino population.
Conclusion: what this means for the Democratic primary going forward
Clinton continues to benefit from strong support from strong African American support. The same cannot be said of other non-whites, particularly Hispanics/Latinos, with whom Sanders is substantially more competitive. Non-whites are not a homogeneous or monolithic group. Hispanics and Asian Americans are different from African Americans, and so far, they are not voting in the same ways. In particular, we should expect Clinton to do well in heavily African American neighborhoods — a bit less well among African Americans in less homogeneous areas. The same extends to a lesser degree to Hispanics and other non-whites.
Clinton is highly likely to benefit from strong African American support in South Carolina and on Super Tuesday. But Super Tuesday is not representative of the country as a whole. It is tilted towards Clinton's strongest region (the South), and her strongest demographic (African Americans). The easiest path to victory for Sanders, and the one he is most likely to take if he wins, is to win in the Northeast, the Midwest, and the West. Key to that path to victory for Sanders is doing comparatively well among Hispanics — not necessarily winning them (though that would help), but getting greater support than from African Americans. Under all plausible scenarios, including those in which Sanders wins the nomination, Clinton will win South Carolina as well as winning most states across the south. The key point is the margins by which she does so.
With as little as something in the range of 30% support from African Americans, 45% support from Hispanics, and 57% or so support from Whites, Sanders can be competitive with Clinton nationally. With even just a bit more than that, he could eke a narrow victory across primaries extending through June. In order to do so, he still has some additional ground he needs to make up. And he needs to make it up as quickly as possible. Clinton remains ahead, and Sanders remains the underdog. But not by nearly as much as Clinton would prefer.
This is a continuing part of an ongoing series using polling data, past exit poll data, census data, and other data sources to analyze the 2016 Democratic Primary.
Previous posts are:
- Poll Meta-Analysis: The Bernie and Hillary 2016 Coalitions, and how they compare to 2008 Obama/HRC
- Poll Data Analysis: The Current State of the Democratic Primary
- How the delegate math shakes out for Bernie and Hillary down to the Congressional District level
- Bernie Sanders Did Much Better With Non-Whites In Iowa Than You Think
- Democratic Primary Model, Feb 8 Update (Pre-NH)
- Democratic Primary Model, Feb 9 Update (Pre-NH)
- Democratic Primary Polls for All 50 States
- Nevada Caucuses Preview and Democratic Primary Model Projections
For more detail on how delegates are allocated across different states, check out this excellent resource from Torilahure.


