Following the conclusion of the 2022 congressional elections, Daily Kos Elections is pleased to unveil the most comprehensive guide you’ll find anywhere to the members of the new 118th Congress and their constituencies. This spreadsheet includes a wealth of demographic and electoral data on both senators and representatives as well as the states and districts they represent, providing key insight on the makeup of Congress and statistics that play a critical role in understanding both chambers. We've also visualized much of this data in charts and maps below.
The guide includes our own calculations of the 2020 presidential elections by congressional district for the new districts following the most recent round of redistricting, preliminary House results for the 2022 midterms, and the results of the most recent election for each senator. It also features vital census demographic statistics, such as racial breakdowns (including by citizenship status) to provide the most accurate estimation of the eligible voter population. It further contains data covering college educational attainment, median household income, and an estimate of the share of eligible voters who are white without a college degree.
For voting members of the House and Senate, we also have statistics on their gender, race or ethnicity, age, LGBTQ status, religious affiliation, and even a name-pronunciation guide. The 118th Congress will be both the most racially diverse and have the highest share of women on record, building on the historic 116th and 117th congresses.
Be sure to bookmark the 118th Congress Guide, since we will update it whenever there are changes in membership or when new demographic information becomes available. Planned updates include data from the Pew Research Center, which will release its latest biennial survey of every member’s religious affiliation in January, and the Census Bureau, which will publish median household income data by House district for the new maps next December. You can also find a detailed explanation of our methodology here.
Below, we'll explore this wealth of data in a series of maps and charts.
The 118th Senate
As shown on the map below of caucus affiliation by state (click here for a larger version), the new Senate will have 51 members who align with Democrats compared to 49 Republicans. Note that the three independents who caucus with Democrats—Arizona’s Kyrsten Sinema, Maine’s Angus King, and Vermont’s Bernie Sanders—are counted as Democrats for all of the statistics below.
All but five senators—three Democrats and two Republicans—belong to the same party as the presidential candidate who last won their state in 2020, which is an all-time record low since all states began holding direct Senate elections in 1914. That list includes Democrats Jon Tester of Montana, Sherrod Brown of Ohio, and Joe Manchin of West Virginia, as well as Republicans Susan Collins of Maine and Ron Johnson of Wisconsin. These five states are also the only ones in the nation with a split delegation, sending one Democrat and one Republican to Washington, D.C.

The next chart summarizes key demographic stats by party caucus for the members of the 118th Senate:
One immediate takeaway is just how demographically unrepresentative the upper chamber is: The next Senate’s membership will be made up of only 25% women, 12% people of color, and 2% LGBTQ; the country as a whole, by contrast, is 50% women and 42% people of color, while a Gallup poll earlier this year found that 7% of respondents identified as LGBTQ. Nonetheless, these figures each sets a new record or ties a previous high, while the median age will be 65, also a historic high. Women and people of color make up a higher share of Senate Democrats than Republicans, though this gap is much larger in the lower chamber, as we’ll discuss just below.
The 118th House
The following chart contains the same information as the one above, except for the House rather than the Senate:
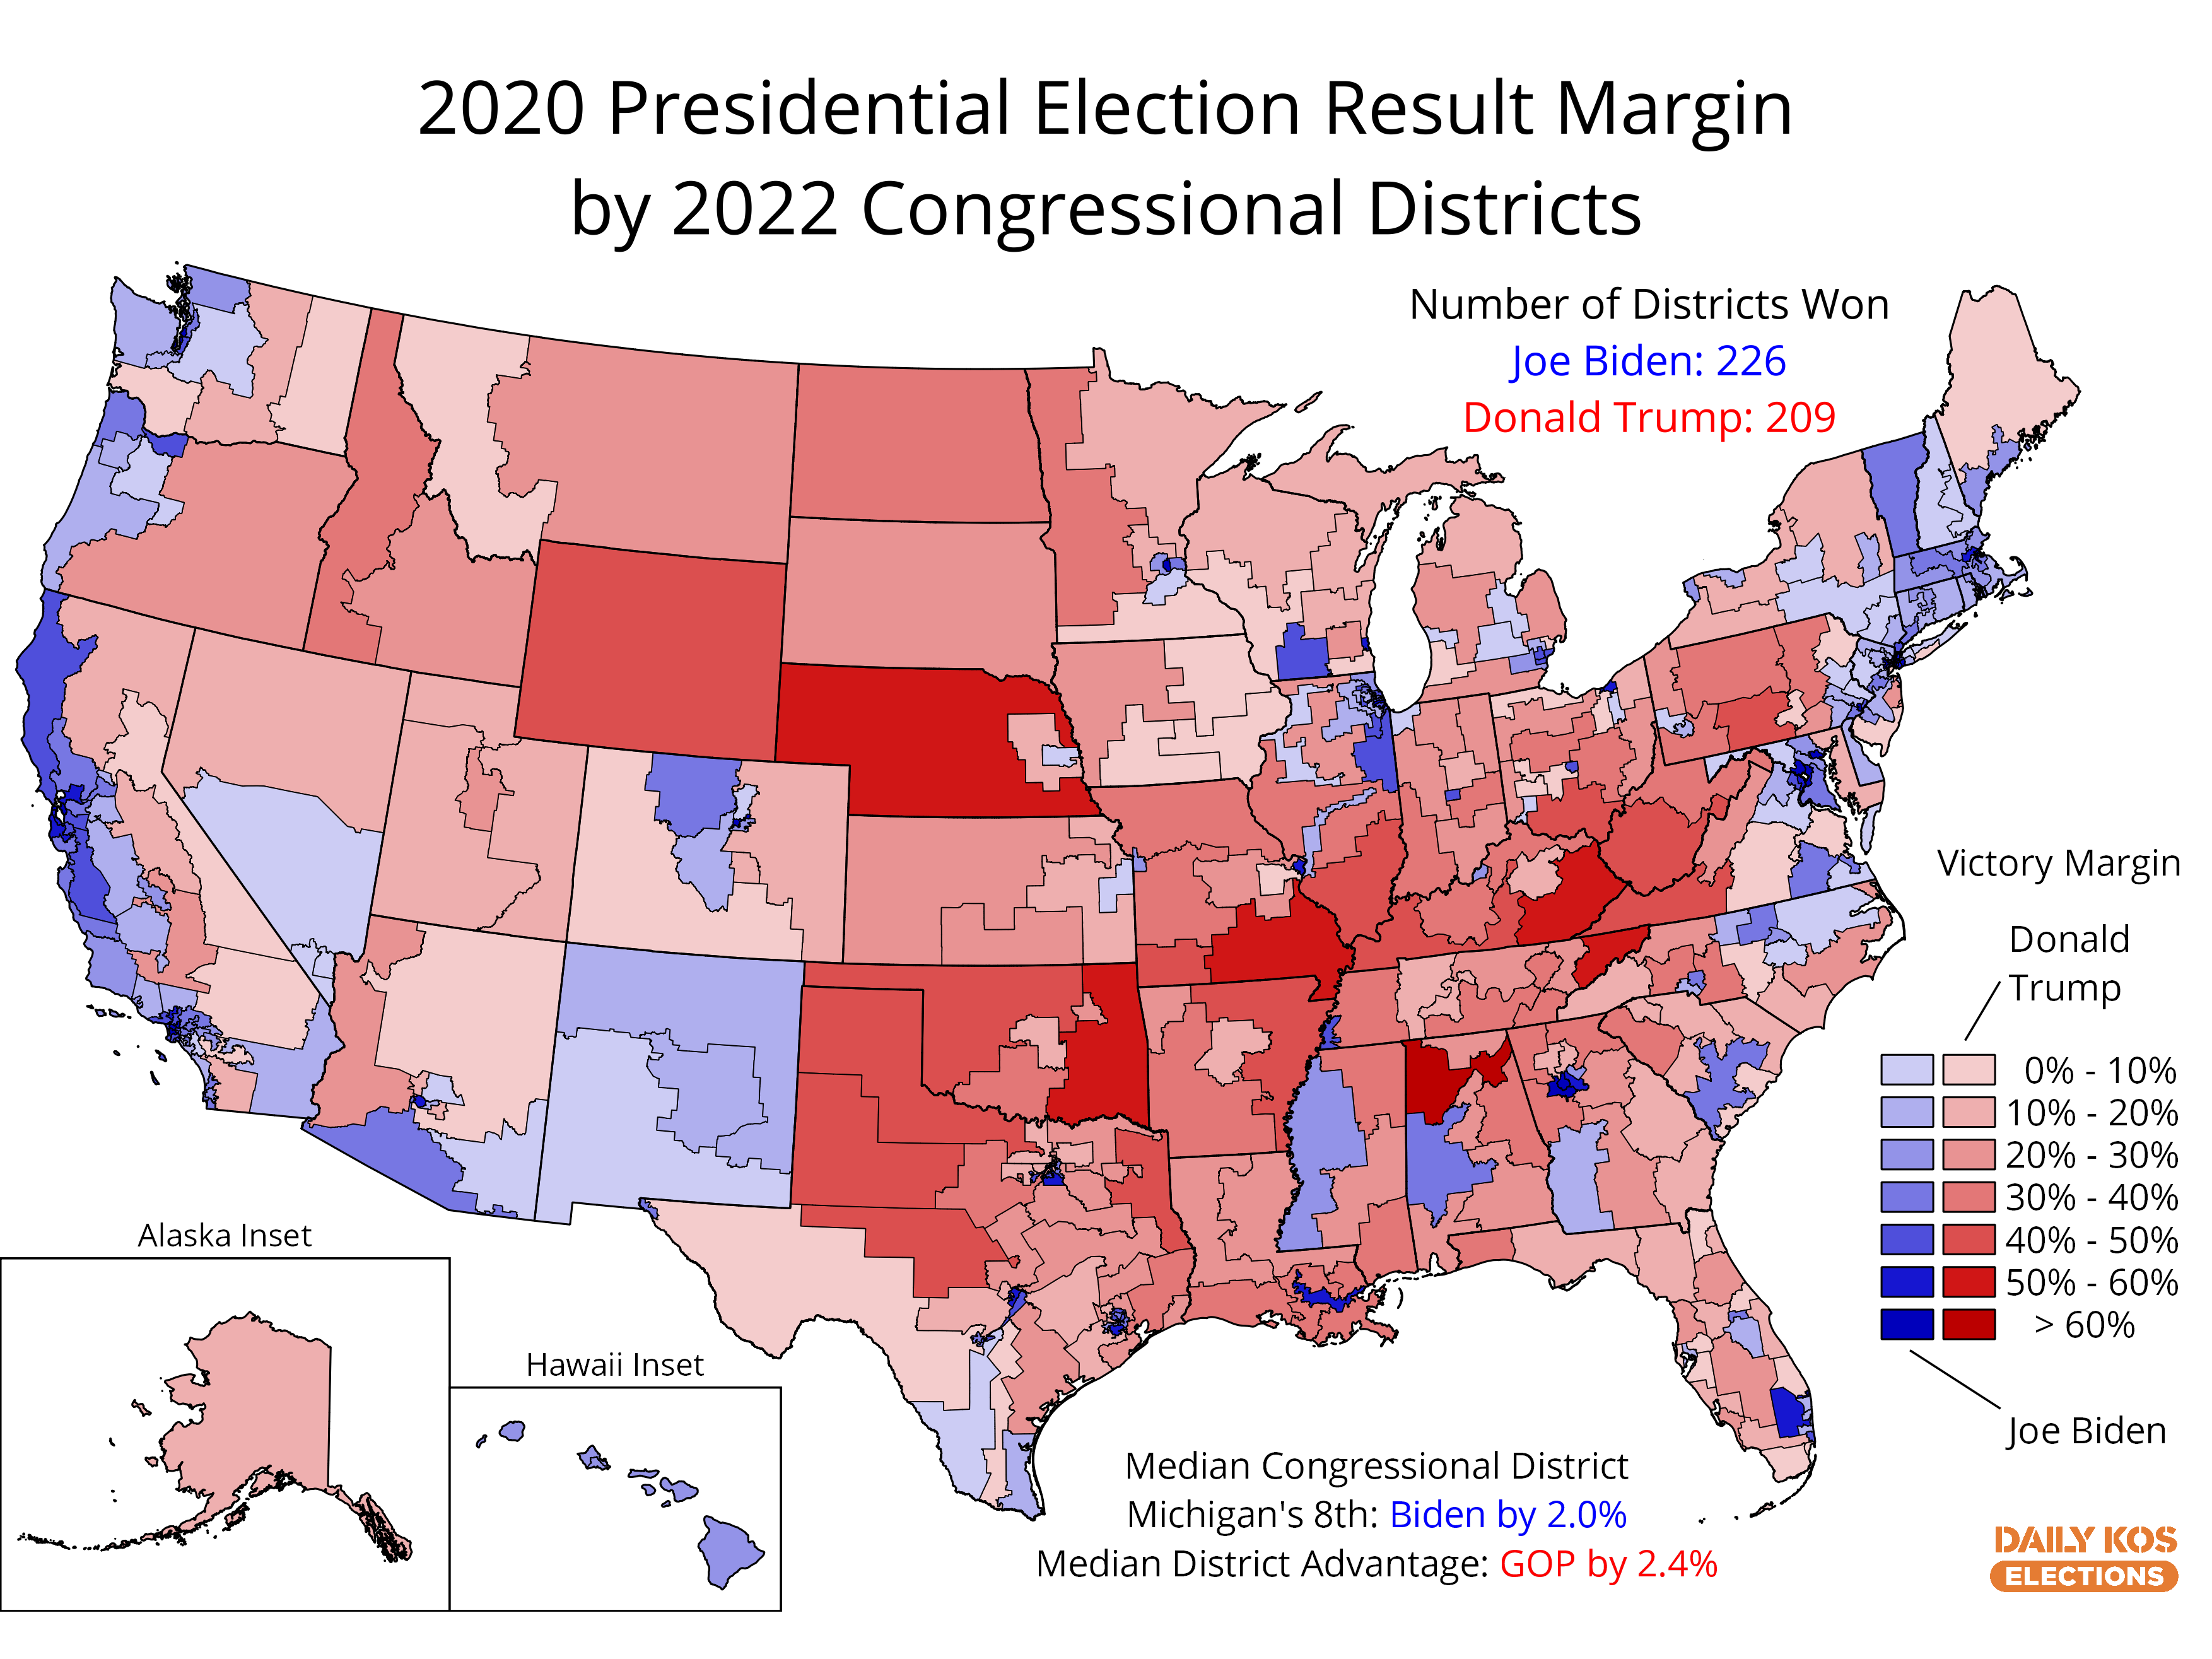
The new House has 222 Republicans, 212 Democrats, and one vacant Democratic seat due to the death of Virginia Rep. Donald McEachin a few weeks after Election Day. There will be 204 Republicans after 2022 who hold seats that would have voted for Donald Trump in 2020, while 207 seats that would have gone to Joe Biden belong to Democrats. Another 18 Republicans will represent districts that would’ve backed Biden while just five Democrats won in districts that would have supported Trump.
You can see this data on these so-called “crossover” districts reflected in the specialized map at the top of this post known as a cartogram. This cartogram, one of many created by Daily Kos Elections' Daniel Donner, shows each House district as equally sized to avoid the distorting effects of traditional maps, which typically render small urban districts invisible while making large rural districts appear too prominent. (You can click here for a larger version and here for a traditional district map.)
As illustrated in the next map (click here for a larger version), November saw the election of 75 new House members, or 17% of total membership, including 34 Democrats and 41 Republicans. (Note that one newly elected member, Montana Republican Ryan Zinke, had previously served a separate non-consecutive tenure from 2015-2017.) The last decade of House elections has seen a historic rate of turnover, particularly among Republicans during the Trump era. Members with three or fewer consecutive terms under their belts now make up 47% of the House and 52% of Republicans.

Breaking down the 75 newly elected members by both party and gender as demonstrated in the next cartogram (click here for a larger version), we can see that 45% of the 34 new Democrats are women compared to only 17% of the 41 new Republicans.

There’s a similar gender disparity when looking at the full House membership by party on the next cartogram below (click here for a larger version). In total, 2022 saw the election of a record-setting 124 women, which was a slight increase over 2020, though at just 29% of the chamber, women are still far from attaining parity. Democrats, however, are much closer to evenly split, with women making up 43% of their ranks compared to just 15% for Republicans.

Looking next at the ages of the new House members is a reminder that the U.S. Congress is one of the oldest legislatures in the world—not just in terms of the institution’s existence but also in terms of its actual membership. The median House member was born in 1965 and will be 57 years old when the new Congress takes office on Jan. 3. By contrast, the median American is between 38 and 39 years old.
Although American voters over the last two decades have shown sharp polarization along age lines, with younger voters favoring Democrats by large margins and middle-aged and elderly voters typically supporting Republicans, there is almost no difference between the median ages of the two parties’ House members. And as shown on the two graphs below plotting each party’s House membership by birth decade, the main difference is that Republicans have dozens of more members born in the 1960s while Democrats have more who were born in the 1940s or earlier.

In fact, there are more Democrats born before 1950—17% of their overall number—than there are who were born from 1980 onward, who make up just 16% of the total. However, the Democratic skew toward more elderly members is a little less surprising when viewed in light of the fact that the typical Republican has served for a shorter tenure, as noted earlier.
Meanwhile, the new House also gained one additional member who identifies as LGBTQ for a record 11 in total, 10 of whom are Democrats. The lone LGBTQ Republican is New York's George Santos, who won what was the country’s first-ever general election between two gay major-party candidates. His victory makes him the first LGBTQ Republican to openly serve since 2006, and the first ever who was out at the time of his initial election.
Just like with its record number of women, the new Congress will also see the highest proportion of House members who belong to racial or ethnic minorities based upon member self-identification. (Note that we have categorized members claiming multiple categories differently than for past Congresses, which increases their numbers slightly.)
Including members who belong to one or more racial or ethnic groups, 13% of House members identify as Black or African American, 11% identify as Latino or Hispanic, 4% identify as Asian, and 1% each claim Middle Eastern ancestry or identify as an American Indian or Alaskan Native as shown on the cartogram below (click here for a larger image). Overall, 4% of members belong to multiple groups.

Latino representation in particular grew by several more members to a record 49 and saw the first-ever election of a Brazilian American member with the aforementioned George Santos. Democrat Marty Peltola, who first won in a special election in August against Republican Sarah Palin to represent Alaska’s At-Large District, also became the first Alaska Native to serve in Congress and won a full term in November.
As one might expect, the two parties differ sharply when it comes to race and ethnicity as illustrated on the next two cartograms (see here for a larger map for Democrats and here for Republicans). People of color are just slightly below half of the House Democratic caucus and comprise a majority or even all of their members in several state delegations across the South and Southwest along with a handful of Northern states such as New York.

By contrast, as illustrated below, almost nine out of every 10 House Republicans identify as white with European ancestry. Half of the 26 Republicans who belong to minority racial or ethnic groups come from just the three largest states, California, Florida, and Texas.

The graph below also presents another way of visualizing the partisan disparities in gender and racial representation by comparing each party’s caucus with Americans as a whole. Unsurprisingly, Democrats come close to reflecting America’s racial diversity and near-even gender balance, while white men remain the overwhelming majority of Republicans.

One topic we haven’t visualized yet is the religious affiliation of the members new Congress, since that data is harder to come by. We therefore won't have a complete picture until Pew releases its newest survey of the entire membership next month, at which point we will update the guide.
However, among the 364 House members for whom we have data, at least 31 belong to religious minorities, including 25 Jews, three Muslims, two Hindus, and one Buddhist. In the Senate, at least nine members are Jews and one is Buddhist.
Not only does our guide have information on member demographics, it also contains a wealth of demographic and partisan statistics for the states or districts that they represent, starting with our own calculations of the 2020 presidential election results for each district in the newly redistricted House map, which show that Biden won a modest majority of 226 out of 435 districts, roughly 52%. We have illustrated these presidential results both as a traditional map (see here for a larger image) and a cartogram (click here to enlarge):

Thanks to Daily Kos Elections' David Jarman, we also have college educational attainment rates by congressional district and state via estimates created using data from the American Community Survey, which is a large statistical sample of American households conducted by the Census Bureau that includes a long list of demographic, economic, and other data points complementing the briefer decennial census. The cartogram below (see here for a larger version and here for a traditional map) reveals a pattern of suburban and urban districts having the highest rates of adults holding a bachelor’s degree or higher while rural districts trail further behind.

Overall, 34% of adults aged 25 and older hold a four-year college degree. However, thanks partly to their concentration in cities and suburbs and the way the districts were drawn, 253 of 435 districts, 58% of the total, actually have a lower rate of college degree-holders than the country as a whole. Our guide also presents this same information for just the white population, which became highly salient for electoral outcomes in the Trump era as college-educated whites swung hard toward Democrats while whites without a college degree shifted considerably toward Republicans (educational polarization has been much less pronounced among voters of color).
Our guide also contains data on the racial composition of each congressional district, both for the total population and also broken down by adults and just the adult citizen population, which best approximates the eligible voter pool in each state or district.
Since members represent everyone in their district regardless of whether they can or do vote, we’ve mapped the total population by major racial or ethnic group for each House district below (click here for a larger version and here for a traditional map), starting with non-Hispanic whites, who at 58% are the largest racial group. They form a majority in 304 districts and a plurality in another 41. Note that this series of maps uses a logarithmic scale to better emphasize smaller population percentages.

At 19% of the population, Hispanic or Latino Americans are the second-largest group after whites and one of the fastest growing in recent decades. As shown in the next cartogram (click here for a larger version and here for a traditional map), they form a majority of the population or close to it in a number of districts across the Southwest, Florida, the New York City region, and the Chicago area, many of which are protected by the Voting Rights Act. In total, Latinos are a majority in 40 districts and a plurality in an additional 13.

Black Americans comprise the third-largest racial group at 14% of the population. They form a majority of constituents or close to it in many districts across the South, many of which are mandated by the Voting Rights Act, and also in many of the cities in the Northeast and Midwest, as shown on the cartogram below (click here for a bigger version and see here for a traditional map). In total, 14 districts have a Black majority while another 15 have a Black plurality. However, many Southern states in particular could have drawn additional districts where Black voters could have elected their preferred candidates, a topic that is the subject of ongoing litigation in several states.

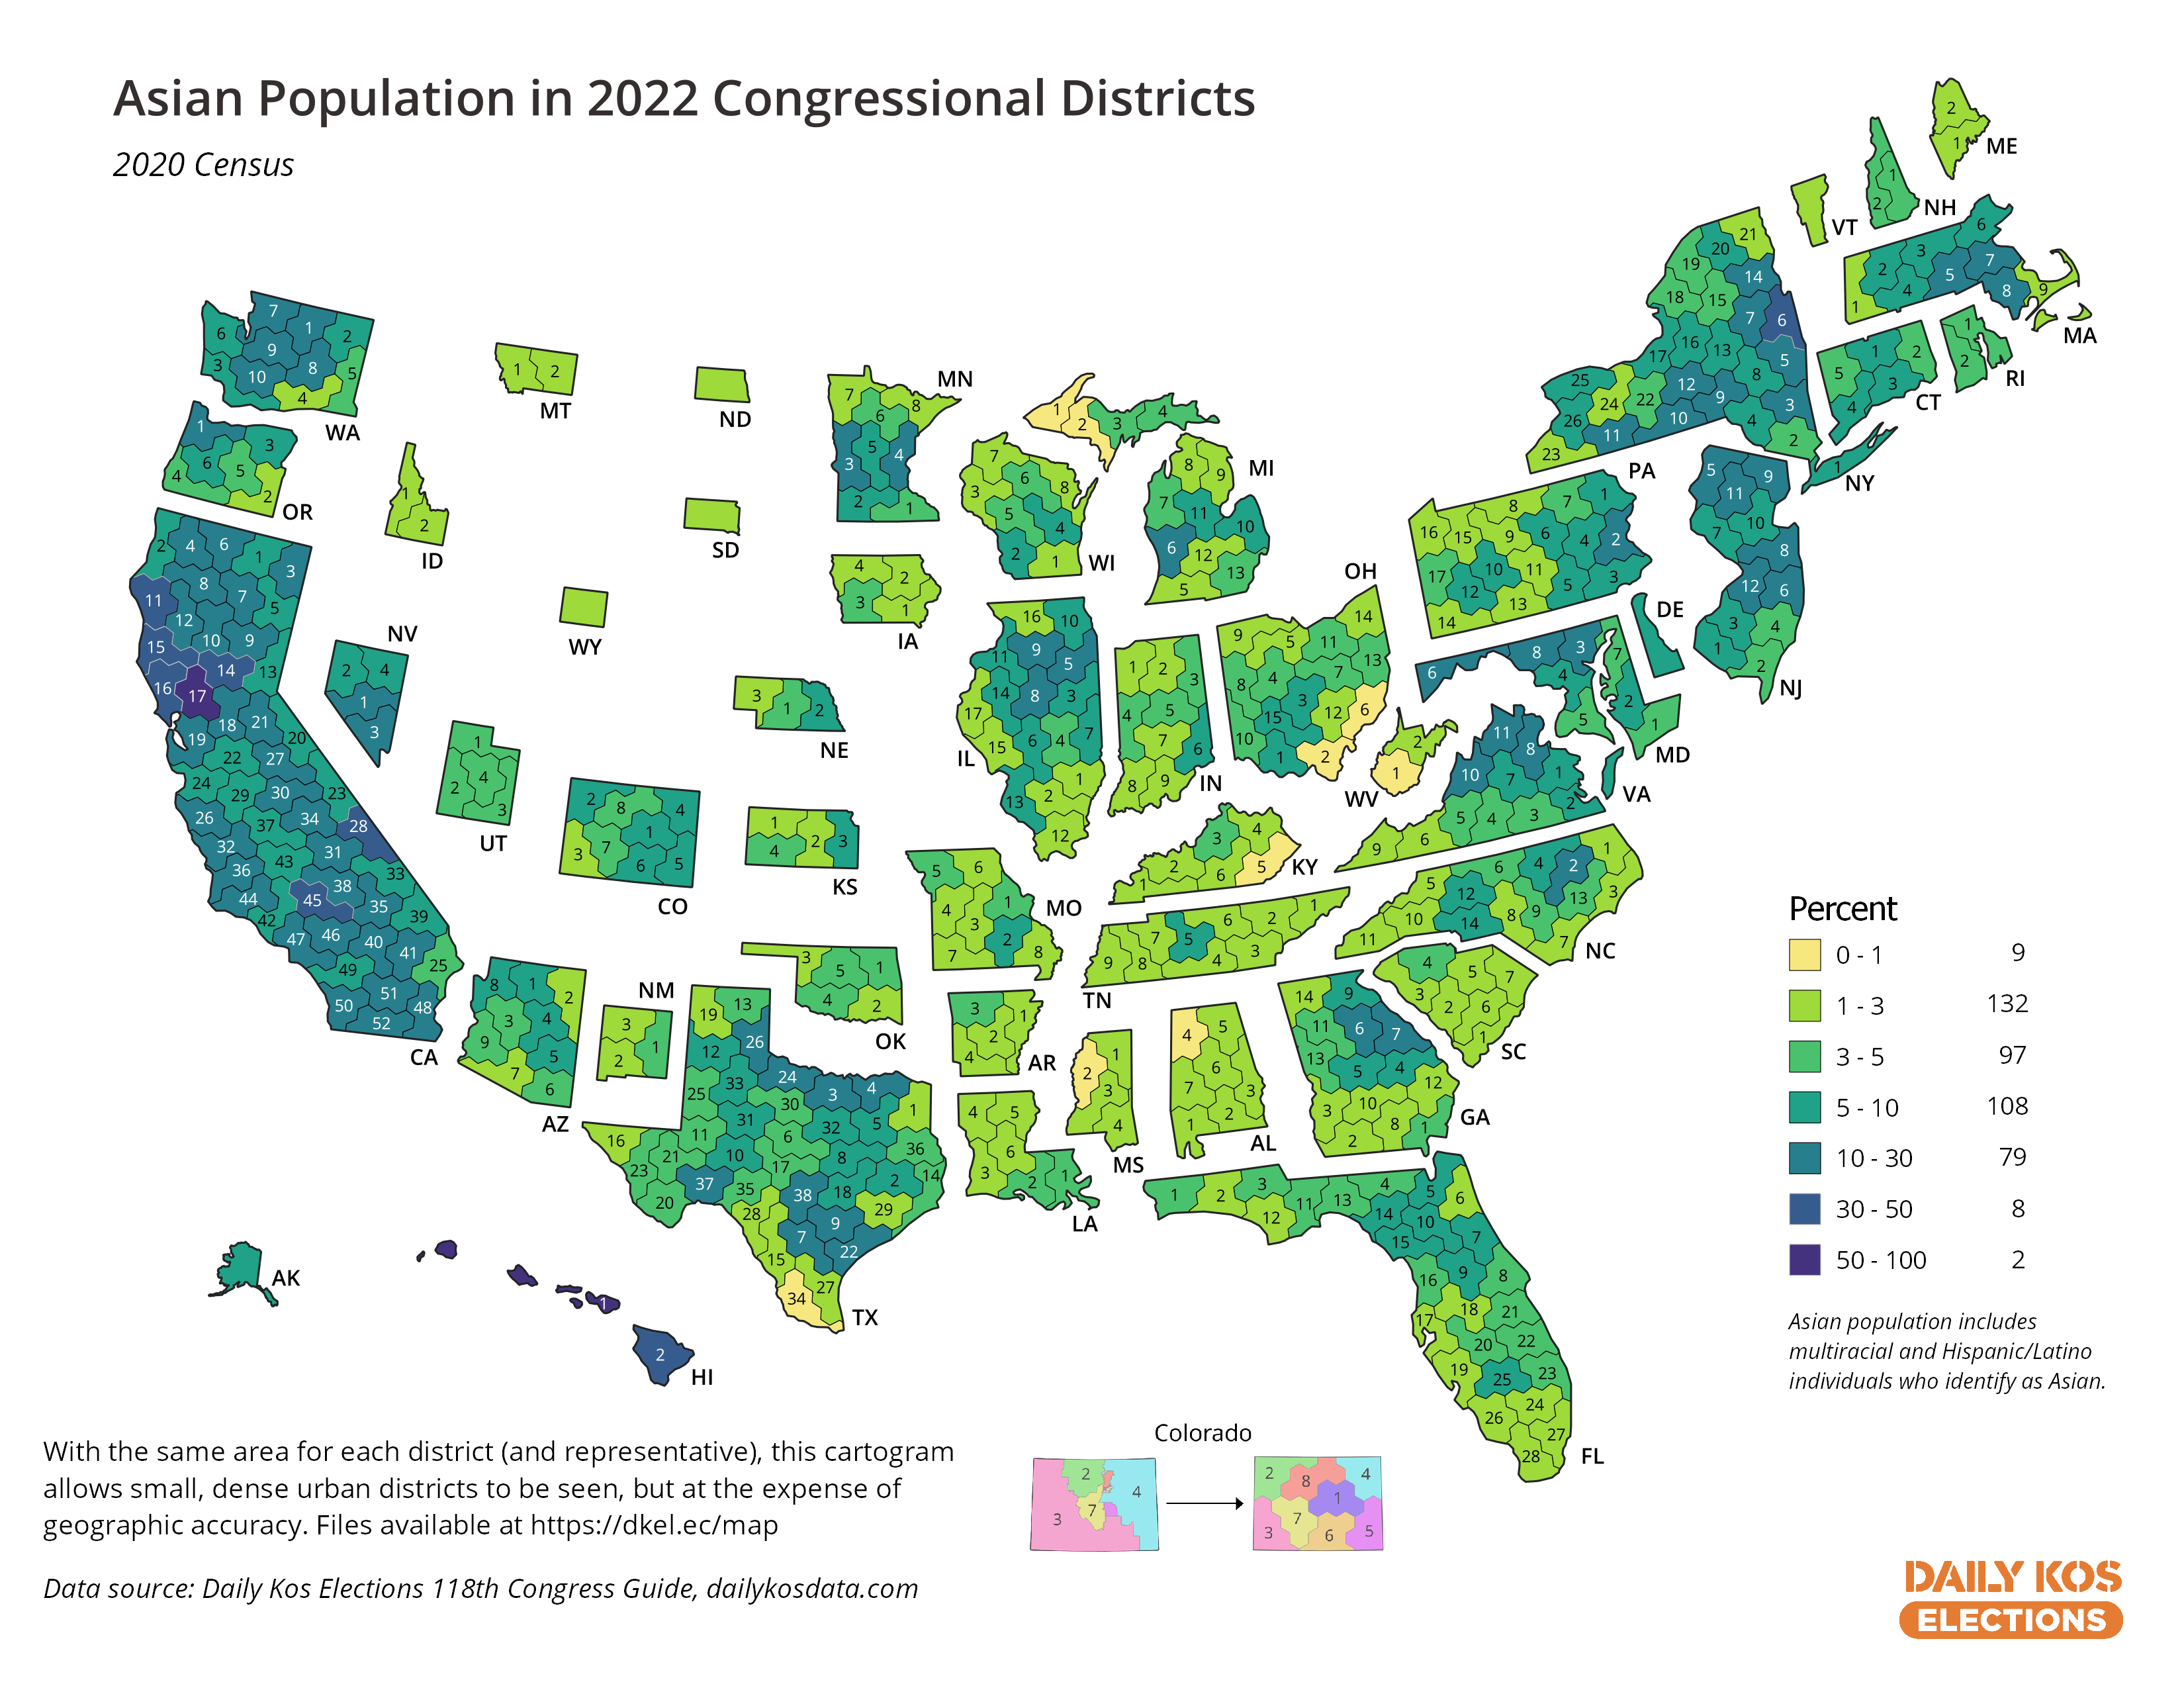
Asian Americans are the fourth-largest racial or ethnic group, and although they are only 7% of the country's population, they are also one of the fastest growing. As illustrated in the cartogram below (click here for a full-size version and see here for a traditional map), Asians form the majority of the population in just two districts, Hawaii's 1st in the Honolulu area and California's 17th in Silicon Valley. However, they make up a plurality in an additional six and are a substantial portion of the population in many districts in California and in many suburban areas of big cities in Texas and the eastern U.S.
American Indians and Alaska Natives are the next-largest group at 3% of the population, and although they don’t come close to a majority in any district, they form a significant part of the population in several districts across Oklahoma, the northern Great Plains, Arizona, New Mexico, and Alaska, as shown in the cartogram below (click here for a larger image and see here for a traditional map). The most heavily Native district is eastern Oklahoma’s 2nd at 29% of the population, while 10 districts in total have a Native population over 10%.

The final racial group is Native Hawaiians and other Pacific Islanders, who are only 0.5% of the national population but comprise 33% in Hawaii's 2nd District and 21% in Hawaii’s 1st, as shown in the last cartogram (click here to enlarge and here for a traditional map). Hawaii accounts for one of every six members of this group, who make up no more than 3% of the population in any district outside of Hawaii, but many districts across the Western U.S. have a Pacific Islander population above the national average, with Washington's 10th having the largest of any mainland district at 3%.

This guide was compiled by Daily Kos Elections' Stephen Wolf and Daniel Donner. We owe a special thanks to Bernard Fraga, Hunter Rendleman, FiveThirtyEight, the Hindu American PAC, Indian Country Today, the Jewish Telegraphic Agency, the Justice Education Technology Political Advocacy Center, the LGBTQ Victory Fund, OpenSecrets, and Rutgers University's Center for American Women and Politics for sharing a host of member demographic data with us, as well as to the Pew Research Center for its biennial survey of every Congress member's religious affiliation. See here for a full accounting of our methodology and other sources.


