Check out the figures for unemployment and jobs #s — in simple pix/ charts. These show visually a clear continuum trend from 2010. They illustrate an economic glide-path extended steadily from the 7 years up to, and continuing since, Inauguration Day 2017. The White House says the economy is newly “resurgent”, but the numbers tell another story.
First, the trend for the all-civilian Unemployment rate, shows undeniable improvement since 2010, from each December-to-December
(and through to the most recent month reported, July).
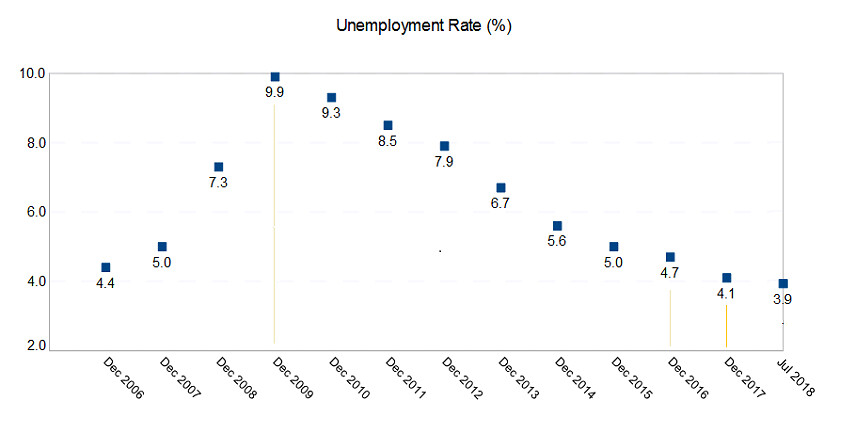 Unemployment rate, year-end (and latest reported month, July). Source data: Bureau of Labor Statistics (BLS)
We see the rate of Unemployment plummeted from 9.9% in December 2009, to 4.7% during Obama’s last full month in office — falling a full 5 points from its peak in 2009, near the 2008-09 recession.
In 2017, Trump’s first year, unemployment fell from 4.7% to 4.1%, and then continued a slight improvement through the first half of this year.
At 3.9%, the rate of unemployment in the last reported month reported, for July, is near the low that occurred in April 2000 (3.8%) during the Bill Clinton presidency.
Note, these charts show vertical boundary lines with thin tan vertical markers near the start of Obama’s presidency (December 2009, at the bottom of the 2008-09 recession) and at the end of Obama’s presidency (December 2016), and marking the first-year mark of Trump in yellow (December 2017). All data in these charts are the seasonally adjusted numbers, from the Bureau of Labor Statistics (BLS).
If you look at unemployment trends by demographic breakdown, you’ll see a similar continuation of gains from the years preceding. Here is for African-Americans:
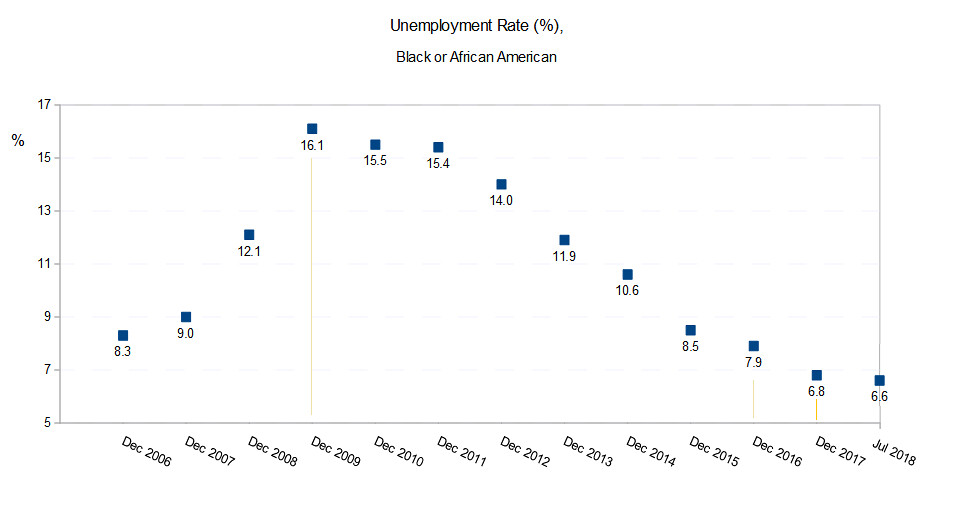 Unemployment rate, Year-end (and July), black/African-American. Source data: Bureau of Labor Statistics
Unemployment for Blacks, under Obama, was sliced in half from early in his term, from 16% at the end of the first year of his presidency, during the tail end of the 2008-2009 recession, to just under 8% in the last month of 2016. More detail on demographic group breakdown is further below, with month-to-month data from the BLS website.
Here are the numbers of new jobs created.
The chart shows change from year ago.
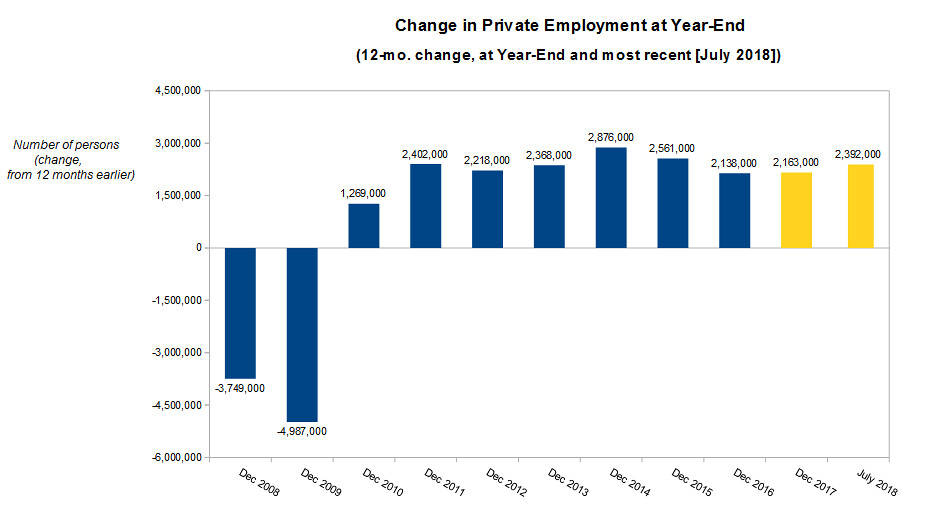 12-month Change in Private Sector employment. Source data: Bureau of Labor Statistics
During the Obama recovery, the average year-to-year gain in private sector jobs from December to December was 2,262,000 employees per year, or 2,427,000 per year after 2010 on average, from 2011 to 2016 (because 2010 had half as much gain as all the years that followed). At the end of Trump’s first year: the bump was 2,163,000 (12-month change Dec 2016 - Dec 2017).
The employment/ unemployment charts above are ones I constructed, from year-end data, along with most recent month reported.
For simplicity, and going straight to the source, here are charts (of all months) from the web pages of the Bureau of Labor Statistics for monthly unemployment — seen at this page link (for total; and latino/Hispanic; black/African-American; Asian-American). The figures are accessed from the single link, then can just click on the each heading, e.g., for “Hispanic or Latino”, or for “Total”.
The 3.9% unemployment rate overall, which has been near an 18-year low, has followed the steep decline seen since 2010.
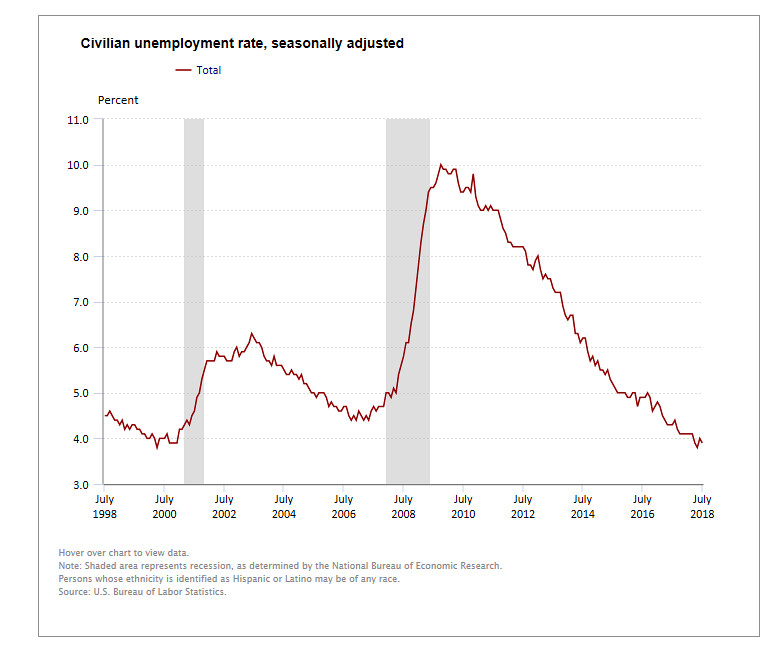 Total Civilian unemployment rate (%). BLS link: https://www.bls.gov/charts/employment-situation/civilian-unemployment-rate.htm#
Here are the figures for the Hispanic labor force.
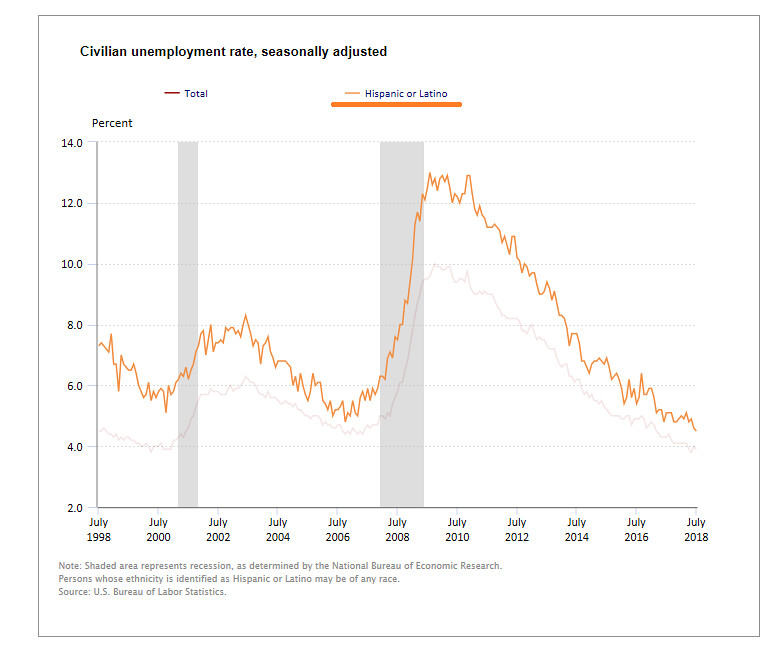 Unemployment rate (%), Hispanic/latino. Link: https://www.bls.gov/charts/employment-situation/civilian-unemployment-rate.htm#
Here is the chart of the monthly unemployment rate for blacks/African-American.
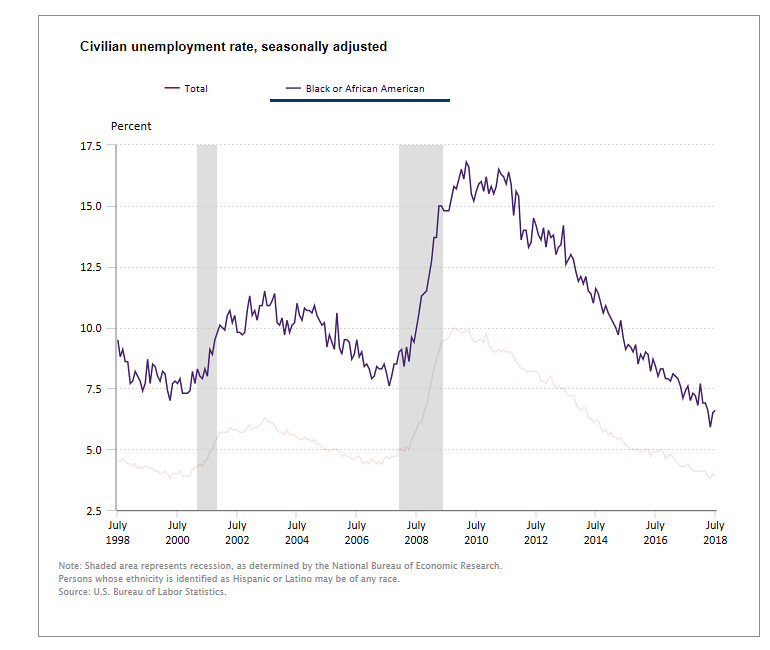 Unemployment rate (%), black/African-American. BLS link: https://www.bls.gov/charts/employment-situation/civilian-unemployment-rate.htm#
Here is the figure for unemployment of Asian-Americans, in blue.
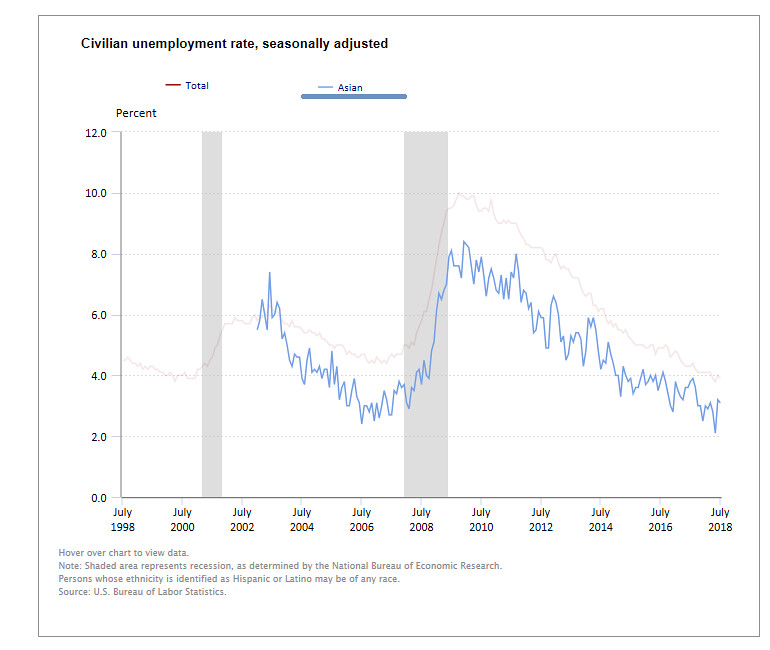
Unemployment rate (%), Asian-Americans. BLS link: https://www.bls.gov/charts/employment-situation/civilian-unemployment-rate.htm#
Here is the figure for youth unemployment, age 16-19 years old.
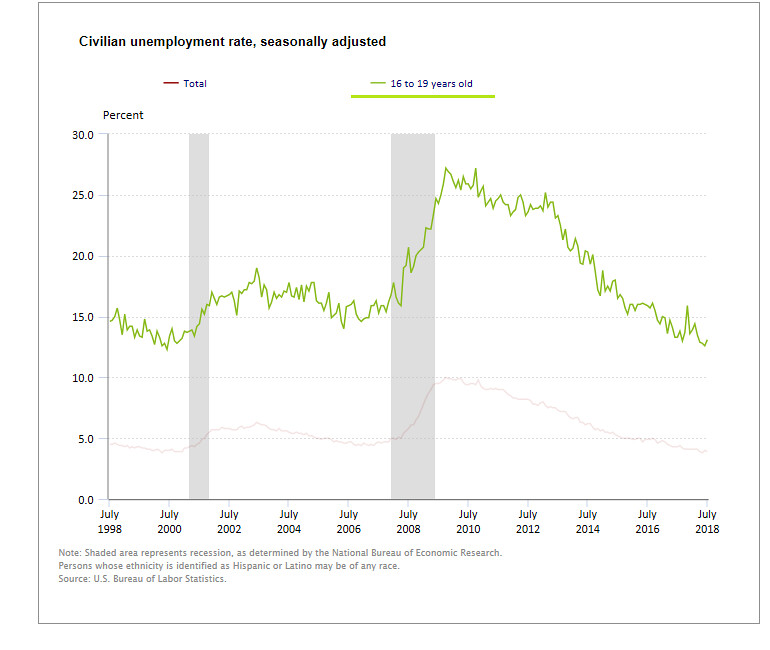 Unemployment rate (%), 16-19 years old. BLS link: https://www.bls.gov/charts/employment-situation/civilian-unemployment-rate.htm#
The US economy is beneficiary of an expansionary record that has solidified through the last 7 to 8 years.
In the key Manufacturing sector, the Obama presidency turned around — from 2010 forward — the earlier enduring slippage in manufacturing jobs. See below.
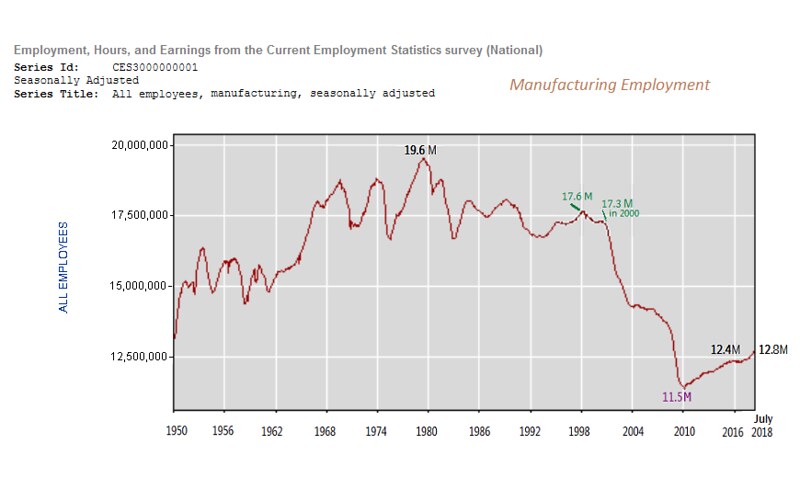 Manufacturing employment, monthly, seasonally adjusted. Source: Bureau of Labor Statistics.
(Link at BLS for monthly series [set the start year to 1950, and check the box for “include graphs”.)
A slide in blue-collar jobs, since 1980, accelerated in the decade from 2000 to 2010, when the economy gave up 6 million manufacturing positions. Since 2010, the U.S. succeeded in adding nearly 1 million jobs in manufacturing industries through 2016. Through 2016 it was the first sustained upturn in Mfg. jobs since the mid-1990s. Jobs in manufacturing grew to 12.4 million workers at the end of 2016, up from its bottom of 11.5 million in 2010. The upward trajectory of manufacturing jobs is continuing under Trump.
----
Also, note the deficit-yawning tax cut enacted for 2018 and for years following will add a sizable ballooning forward risk to the outlook — because the tax-cut timing was pro-cyclical and front loaded, and it is adding stimulus right in the midst of a mature business expansion.
That is, the tax cut amplifies the expansion at a late stage when the recovery is mature, long-in-the tooth (eight years old, since 2010).
However, tax and spending policy are meant to be counter-cyclical, particularly when the economic growth reverses and the economy contracts. That will be the time when fiscal stimulus (tax cuts or spending increases) will be needed. If we’ve already blown the deficit and tax cuts with a pro-cyclical economic move when the economy is chugging along, then we’ll have no fiscal policy tool to right the economy when it heads into a downturn and seriously tanks.
The current Trump economic program is a feel-good-in-2018, pay-for-it-later strategy. On the heels of the salutary economic momentum that Trump inherited, the turn in 2018 to the debt-embracing tax policy that Congress and Trump enacted, merely to goose a mature economic expansion, is high risk to undercut our future prosperity.

