Following the conclusion of the 2020 congressional elections, Daily Kos Elections is pleased to unveil the most comprehensive guide you’ll find anywhere to the members of the new 117th Congress. This spreadsheet includes a wealth of demographic and electoral data on senators and representatives, as well as the states and districts they represent, providing key insight on the makeup of Congress and statistics that play a critical role in understanding both chambers. We've also visualized much of this data in maps and charts below.
The guide includes our own calculations of the 2008-2020 presidential elections by congressional district that we recently finished for 2020, the 2012-2020 House election results, and the most recent Senate elections by state. It also includes vital census demographic statistics, such as the racial breakdowns (including by citizenship status) to provide the most accurate estimation of the eligible voter population. It further contains statistics about college educational attainment, median household income, and an estimate of the share of eligible voters who are white without a college degree, a demographic marker that has become highly salient in the Trump era and beyond.
For each voting member of the House and Senate, we also have statistics on their gender, race or ethnicity, age, LGBTQ status, religious affiliation, and even a name-pronunciation guide. The 117th Congress will be both the most racially diverse and have the highest share of women on record, building on the record-breaking 116th Congress. Be sure to bookmark the 117th Congress Guide, since we will keep it updated as new information becomes available or whenever there are changes in congressional memberships. Below we'll explore these new member demographics.
The chart below summarizes those stats by party for the House. (Note that we have assigned vacant seats to the party, if any, that last held them following the 2020 elections.)
The new House has more than 100 women for the second time in its history, though at 28% of the full chamber, women are still far from parity with men. As shown on the map below, 2020 saw a rebound for Republicans by doubling their proportion of the GOP after it had reached a historic low in 2018, though women are still only 14% of House Republicans compared to 40% of Democrats.
 Click to enlarge
The next map below illustrates which members are new to the House and which are returning veterans. In a reversal of 2018, 2020 saw three times as many Republicans than Democrats who were elected for the first time. (Note that Republican Reps. Claudia Tenney, Darrell Issa, and David Valadao are included among the new members because their previous tenures in Congress were non-consecutive with their current terms.)
 Click to enlarge
In a sharp contrast to 2018, when only one of the 30 newly elected Republicans was a woman, the map below shows that women represent 19 of the 46 Republicans first elected last November. Just as in 2018, a majority of newly elected Democrats were women, with nine out of a total 15.
 Click to enlarge
And as shown on map below, which breaks down membership by race and ethnicity, 2020 saw a very small increase in the proportion of members who are people of color—now more than 27% of the total—but that means we’ve once again set an all-time record.
 Click to enlarge
The partisan divide in race and ethnicity remains sharp, as shown on the two maps below: Among Democrats, just 56% are of solely white-European ancestry, but 91% of House Republicans are.
 Click to enlarge
 Click to enlarge
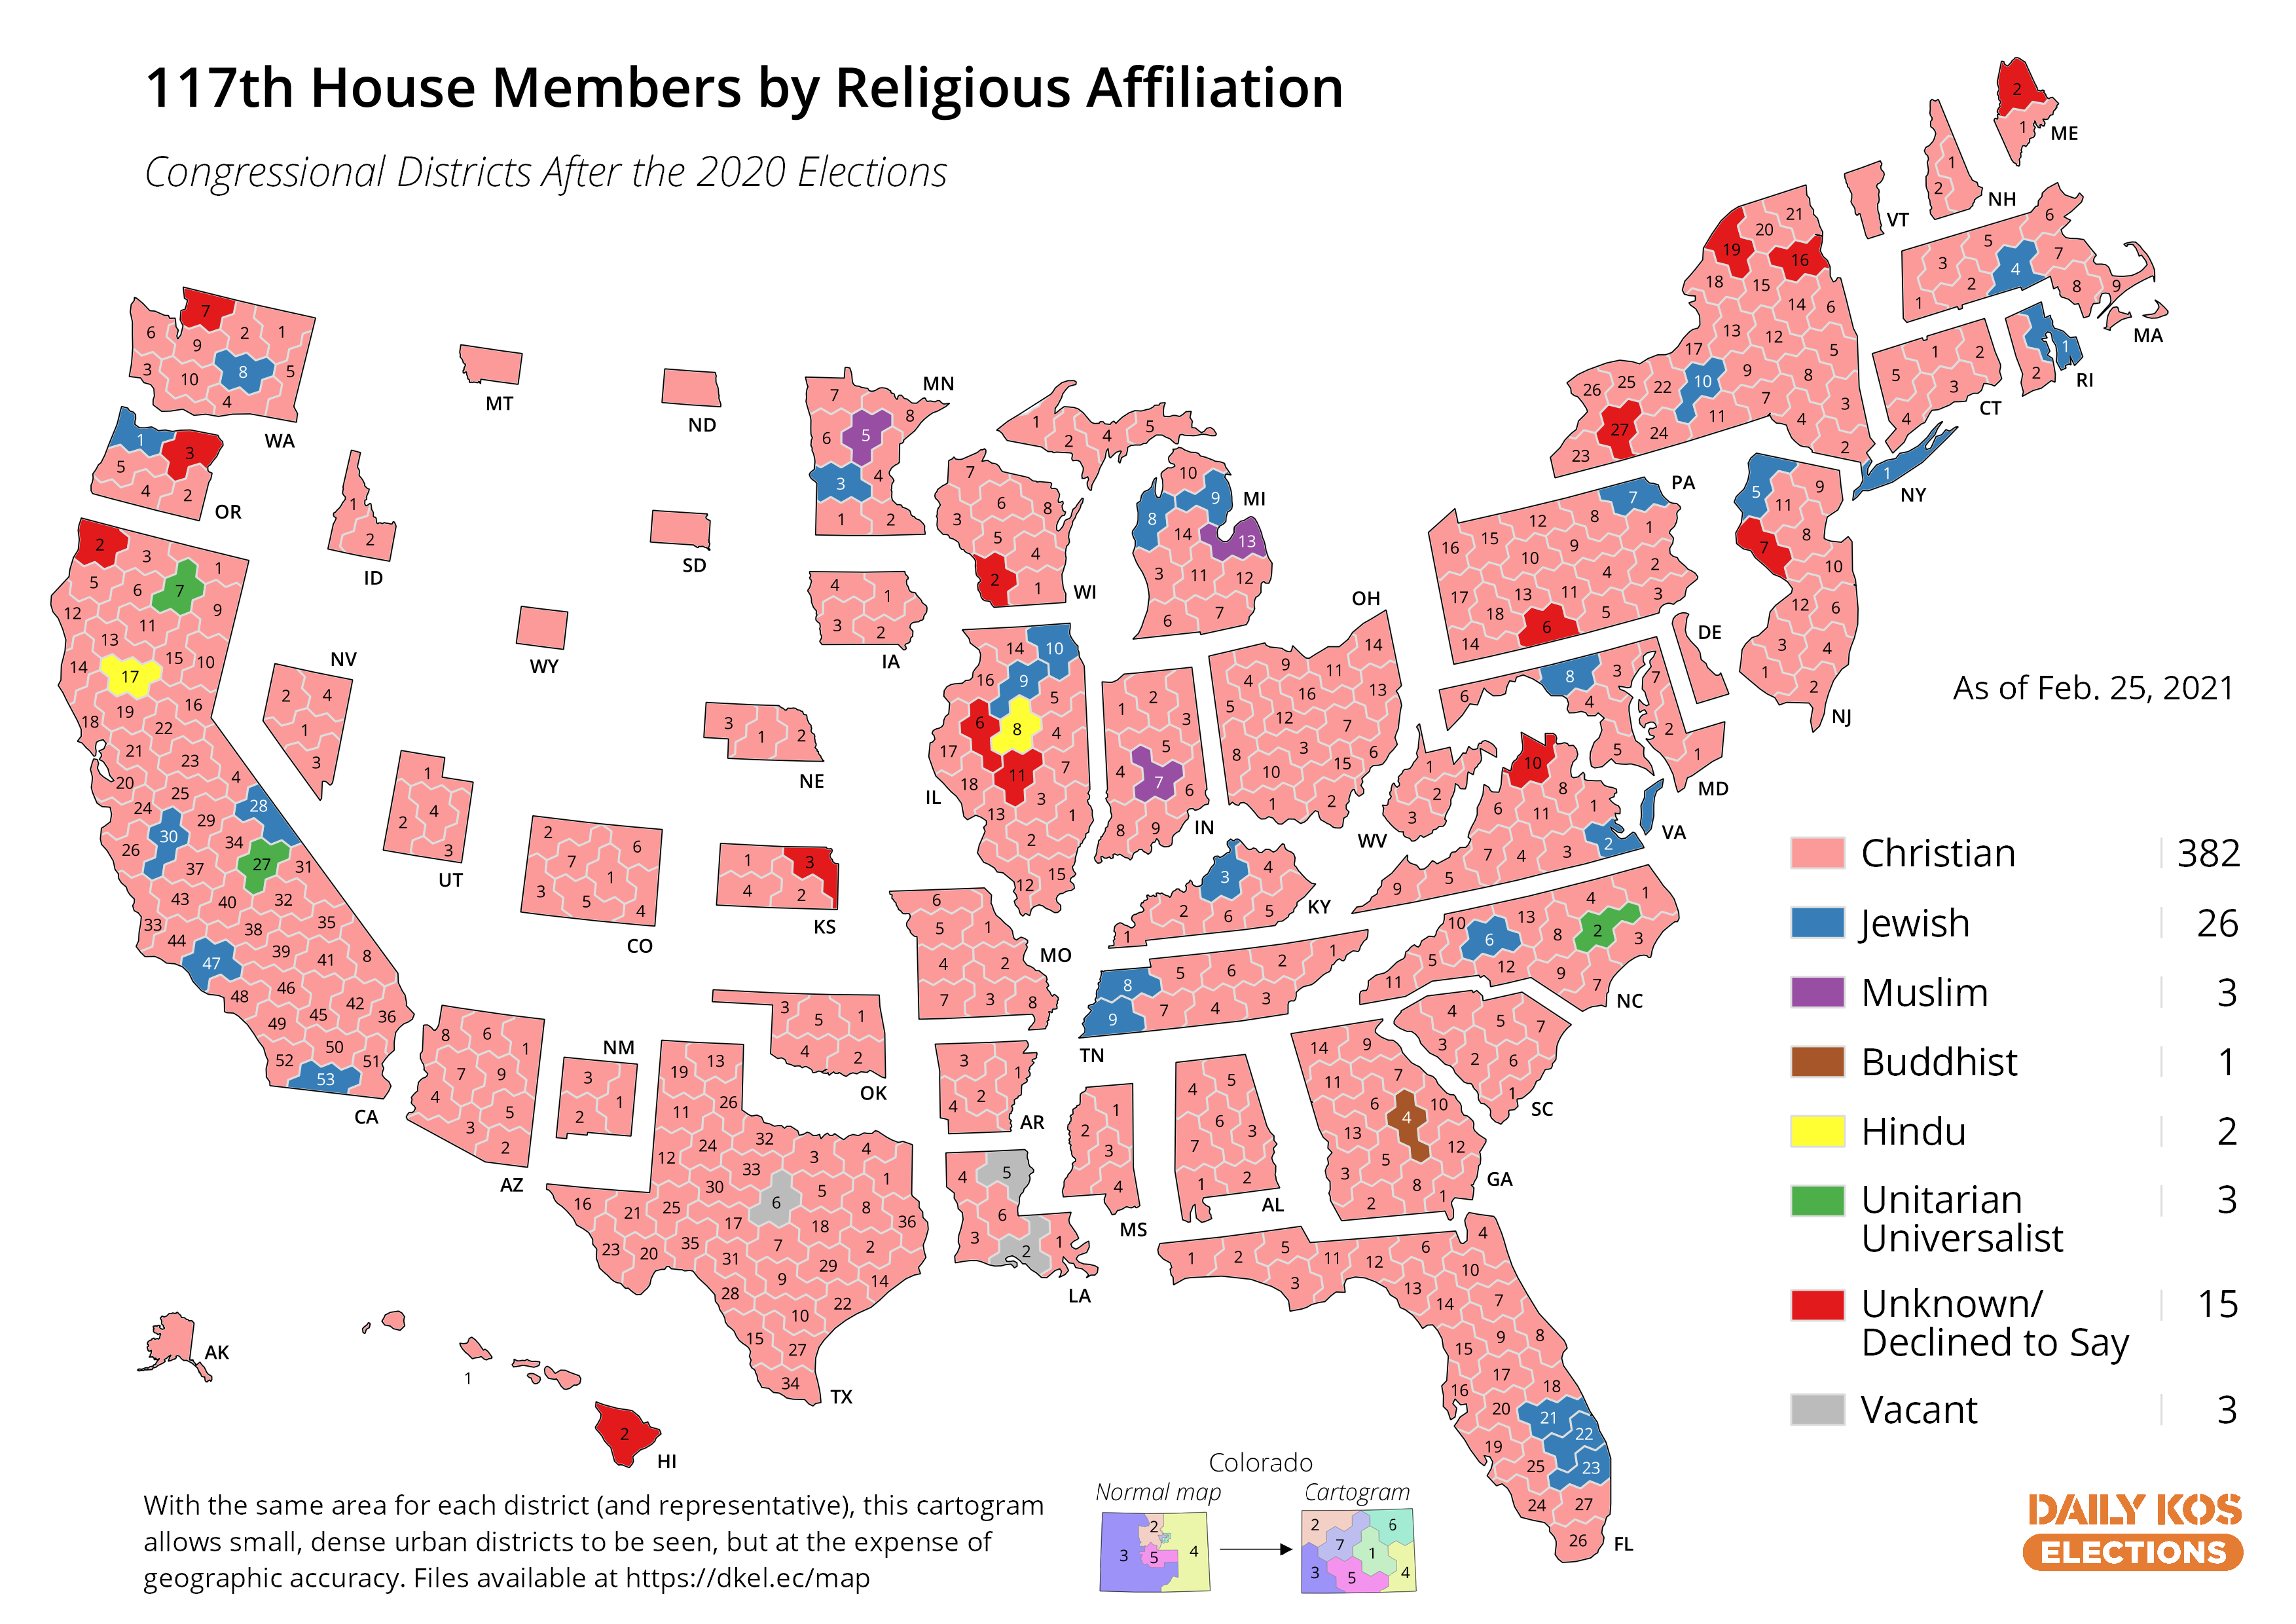
Our final maps illustrate the religious affiliation of the 117th House members, which the Pew Research Center authoritatively catalogs every two years. Christians comprise 88% of the House, Jews are 6%, those who refused to say or whose affiliation is unknown are 3%, and Muslims, Hindus, Buddhists, and Unitarian Universalists are each 1% or less. Further breaking down the 88% of members who identify as Christians, 54% of House members are Protestants (including both mainline and evangelicals), 31% are Catholics, 2% are Eastern Orthodox, and 1% are Mormons.
 Click to enlarge
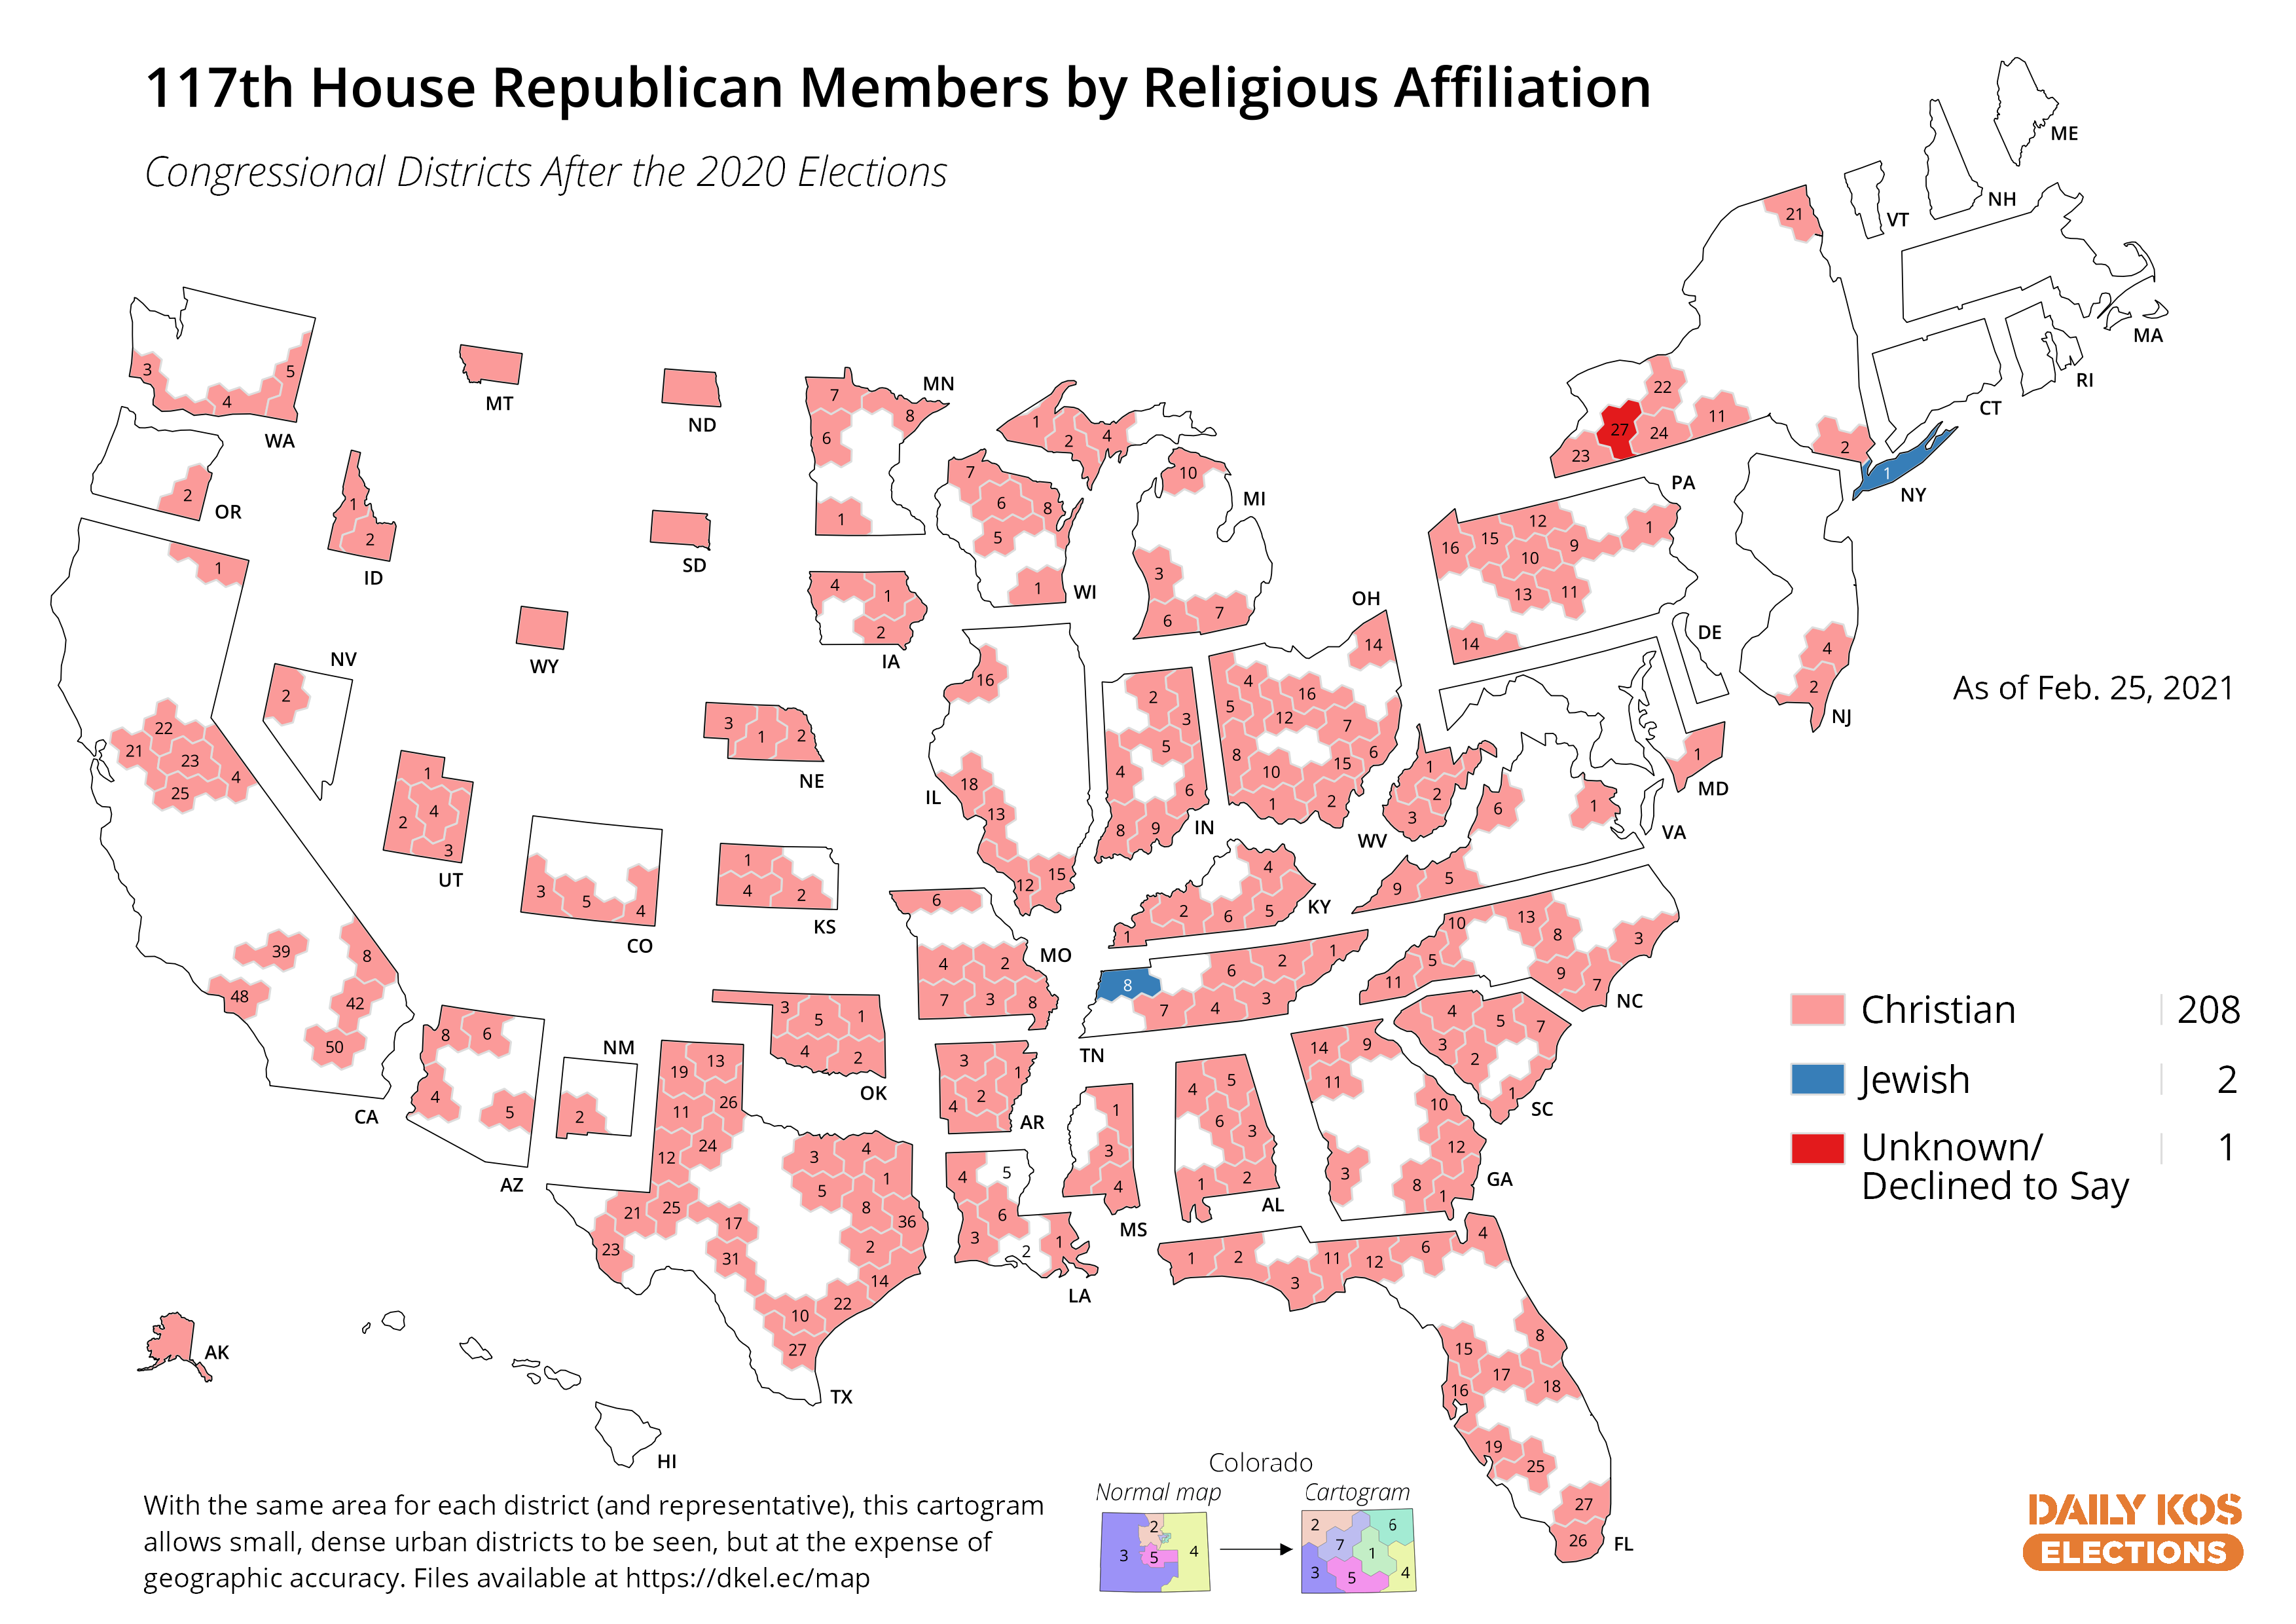
As shown below in the final two maps, the partisan differences in religious affiliation are even starker than racial and ethnic differences. Christians make up only 79% of Democrats but are 99% of Republicans. All but three of the 50 members who don’t identify as Christians are Democrats.
 Click to enlarge
 Click to enlarge
In total, heterosexual, Christian, non-Hispanic white men still make up 49% of the House, roughly double their share of the total population according to estimates from the 2019 Cooperative Congressional Election Study. However, those numbers also sharply diverge by party: This group makes up just 25% of House Democrats but 79% of House Republicans.
Turning to the Senate, the upper chamber is much less demographically representative of the nation as a whole than the House, as shown in the chart below.
Women make up 24% of the total (a similar proportion to the House): 32% of Democrats and 16% of Republicans. The Senate is significantly whiter than the House: Only 11% of senators are people of color, including just 16% of Democrats and 6% of Republicans. Heterosexual, Christian, non-Hispanic white men comprise 60% of the Senate, but just like in the House, those numbers differ significantly by party: They make up 42% of Democratic senators but 78% of Republicans.
This guide was compiled by Daily Kos Elections' Stephen Wolf and Daniel Donner. In addition to data from Pew, we owe a special thanks to the Asian Pacific American Institute for Congressional Studies, the Center for Responsive Politics, the Forward, Indian Country Today, the Justice Education Technology Political Advocacy Center, the LGBTQ Victory Fund, and Rutgers University's Center for American Women and Politics for sharing a host of demographic data with us.


