Huffington Post reports on a series of 3-D Maps of the universe called the 2MASS Redshift Survey, just released by astronomers at the Harvard-Smithsonian Center For Astrophysics
Well, actually, without one of the new “Inter-Galactic 3-D Spectral Observatrons, you’ll have to look at 2-D maps on your computer, or watch 2-D videos flying through this 3-D visual representation of the most complete data-base on our universe every assembled to date.
Due to errors in my href link system I provide the raw link here to both the Huffpo articles as well as directly to the Harvard-Smithsonian site.
http://www.huffingtonpost.com/...
https:/www.cfa.harvard.edu~dfabricant/huchra/2mass/
http://spider.ipac.caltech.edu/...
This summary paragraph has one obvious error it should read 43,000 galaxies, not 43.00
Astronomers at the Harvard-Smithsonian Center for Astrophysics released the most complete 3D map of the universe ever created. The map, called the 2MASS Redshift Survey, spans a distance of 380 million light years, and took over ten years to complete.
Scientists collected data for the map by scanning near-infrared light, the spectral region where interstellar dust is most transparent. The researchers discovered over 43,00 galaxies. The map is color coded so that the most distant galaxies are red, and nearby galaxies purple.
Another cool view:
For those who like the reader's digest version you can skip to the comments from here. For those of you who like hard-core science, and astrophysics at it's very best you really have to go directly to the Harvard Smithsonian, Caltech, and the websites of the astronomers below. Let me give some more detailed information below.
And, for those of you who still don't have the new 3-D InterGalactic Sensory Observatrons, you can watch a video fly-through here at this Harvard Smithonian website
https:/www.cfa.harvard.edu~dfabricant/huchra/2mass/
Harvard 2MASS RedShift Website for Video Fly-Throughs of Known Universe
Large Scale Structure in the Local Universe:
The 2MASS Galaxy Catalog
Thomas Jarrett (IPAC/Caltech)
jarrett@ipac.caltech.edu
Based on an invited talk at the Structure and Dynamics in the Local Universe,
a Sydney workshop to honour Brent Tully's 60th birthday. To appear in
Publications of the Astronomical Society of Australia
ed. J. Bland-Hawthorn.
Reference: Jarrett, T.H. 2004, PASA, 21, 396.
Two Micron All Sky Survey
2MASS is a ground-based, near-infrared survey of the whole sky. It began operations in the mid-1990's and completed observations in early 2001. The final source catalogs and image Atlas was released to the public in the fall of 2002 (Cutri et al 2000). 2MASS is fundamentally an imaging survey, with detection and source characterization derived from images that span the near-infrared windows: J (1.2 µm), H (1.6 µm), and Ks (2.2 µm). The images were acquired using an efficient drift scan and freeze-frame technique, painting the sky with 8.5' X 6 deg tiles or "scans" (Skrutskie et al 1997), forming 23 separate images per tile per near-infrared band of size 512 X 1024 pixels with resampled 1 arcsec pixels. A total of 4,121,439 FITS images cover 4XPI steradians of the sky. These images, 8.5' X 17' in angular size, are also known as "coadds" since they are comprised of ~6 optimally dithered samples per pixel. The effective beam or PSF FWHM is ~2 to 3 arcsec, depending on the atmospheric seeing, and is roughly the same for each band. The typical 1-sigma background noise is 21.4, 20.6, and 20.0 mag arcsec^-2 for J, H and Ks, respectively. The images include a photometric zero-point calibration that is accurate to 2-3% and an astrometric solution that is accurate to <0.2 arcsec (Cutri et al 2000).
Stars and galaxies are detected and characterized from the 2MASS images. The Point Source Catalog (PSC) contains ~500 million objects, largely comprised of stars from the Milky Way. The Extended Source Catalog (XSC) contains ~1.6 million objects clearly resolved by 2MASS, chiefly comprised of extragalactic sources in the local Universe. This paper will focus on these resolved galaxies. The images and source catalogs are available to the public via the Infrared Science Archive (IRSA) and NASA Extragalactic Database (NED) of IPAC.
We're lucky to be able to read this here, now, as scientific publications usually blockade publication of these kind of details, until they release them first. Perhaps, we can view these now, because the author is releasing his own notes for his lecture in Australia?
ABSTRACT
Using twin ground-based telescopes, the Two Micron All Sky Survey (2MASS) scanned both equatorial hemispheres, detecting more than 500 million stars and resolving more than 1.5 million galaxies in the near-infrared (1 - 2.2 microns) bands. The Extended Source Catalog (XSC) embodies both photometric and astrometric whole sky uniformity, revealing large scale structures in the local Universe and extending our view into the Milky Way's dust-obscured "Zone of Avoidance." The XSC represents a uniquely unbiased sample of of nearby galaxies, particularly sensitive to the underlying, dominant, stellar mass component of galaxies. The basic properties of the XSC, including photometric sensitivity, source counts, and spatial distribution are presented here. Finally, we employ a photometric redshift technique to add depth to the spatial maps, reconstructing the cosmic web of superclusters spanning the sky.
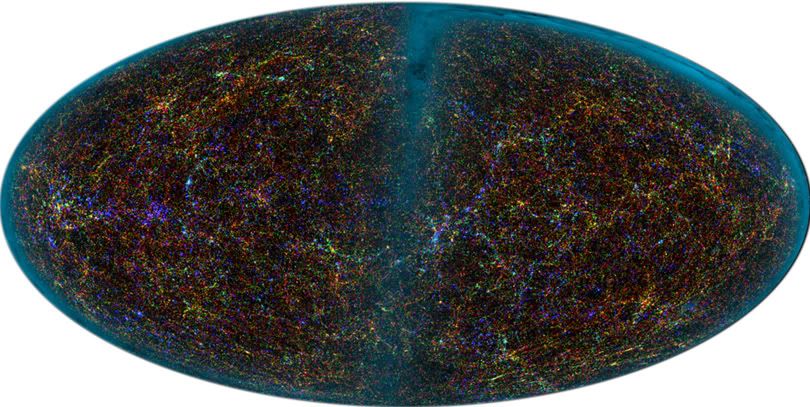
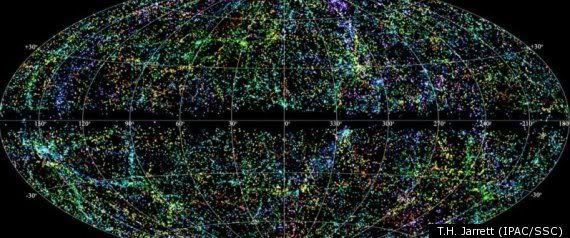
Panoramic view of the entire near-infrared sky reveals the distribution of galaxies beyond the Milky Way. The image is derived from the 2MASS Extended Source Catalog (XSC)--more than 1.5 million galaxies, and the Point Source Catalog (PSC)--nearly 0.5 billion Milky Way stars. The galaxies are color coded by "redshift" obtained from the UGC, CfA, Tully NBGC, LCRS, 2dF, 6dFGS, and SDSS surveys (and from various observations compiled by the NASA Extragalactic Database), or photo- metrically deduced from the K band (2.2 um). Blue are the nearest sources (z < 0.01); green are at moderate distances (0.01 < z < 0.04) and red are the most distant sources that 2MASS resolves (0.04 < z < 0.1). The map is projected with an equal area Aitoff in the Galactic system (Milky Way at center). A locator key is provided in Figure 2; a more detailed chart is given here. An animation that shows the cosmic web separated by sliced redshift is given here-animation (beware: this is 19MB in size).
And from the Introduction of the paper that will be published in the Publications of the Australian Astronomical Society:
Our understanding of the origin and evolution of the Universe has been fundamentally transformed with seminal redshift, distant supernovae and cosmic microwave background surveys. The focus has shifted to the distribution and nature of dark matter and dark energy that drive the dynamics of the expanding cosmos. The study of the local Universe, including its peculiar motions and its clustering on scales exceeding 100 Mpc, is an essential ingredient in the connection between the origin of structure in the early Universe and the subsequent formation of galaxies and their evolution to the state we observe today. Key issues include the location and velocity distribution of galaxies, leading to the mass-to-light relationship between what is observed and what is influencing the mass density field.
Spurred on by the enormous success of the redshifts surveys (cf. Huchra et al 1983), conducted some 20 years ago, pioneers such as CfA's John Huchra proposed to image the entire sky at near-infrared wavelengths to create an unbiased census of galaxies that would fuel the next generation of redshift surveys (e.g., 6dFGS; see Watson et al 2001 and Jones et al 2004) and help address these {it weighty} issues. After much deliberation, what finally transpired some ten years ago now, is the Two Micron All Sky Survey (2MASS). Many years of observations and hard work to detect and extract sources has produced a gap-free image atlas of entire sky, and catalogues containing stars and galaxies. The literature is now populated with many influential papers that used 2MASS to address fundamental extragalactic issues, including luminosity functions (cf. Cole et al 2001; Kochanek et al 2001; Bell et al 2003), galaxy morphology (cf. Jarrett et al 2003), distance indicators (cf. Karachentsev et al 2002), angular correlation functions (cf. Maller et al 2003a), and the dipole of the local Universe (cf. Maller et al 2003b). The 2MASS view of the "cosmic web"--the space distribution of galaxies in the local Universe--is the focus of this paper. Figure 1 is an attempt to encapsulate our present understanding of the large scale structure that embodies the local Universe. Figure 2 provides a locator key to the extragalactic sky. A more detailed sky chart is given here.
FAQ: Did anyone wonder why the second picture has the blank band through the middle? Try to quess before seeing the answer provided by this unusually knowledgable commenter in the comments section.
Tunghoy
Keep in mind, the survey took a very narrow field of view, right through the center of the Milky Way (which is the dark area running horizontally through the center). The approximate total number of galaxies visible from Earth is about 100 billion, with each galaxy having an average 100 billion stars.
I hope folks don't mind such a detailed astrophysics piece here at a political blog. My justification is that my secret plan to win back the House, and retain the Senate and White house is to convince the swing independent voters that Democrats are smarter, better educated, and value education and competence more than the GOP. So let's smarten up fellow Dems, and find ways of dropping the "red-shift" into our water cooler conversations.

