This diary compares the number of registered voters in Arizona in June compared to April. It is an update to my last diary which looked at the historical state of party registration in Arizona.
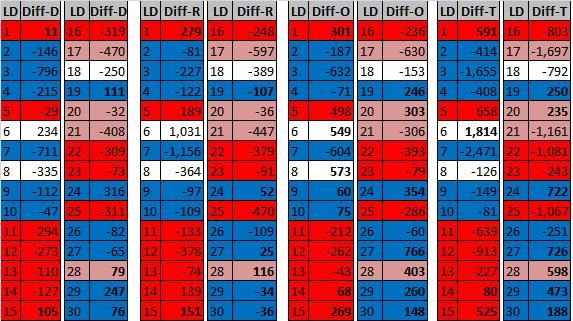
Okay the number you have all been waiting for... the number of Registered Democratic "Active Voters" in Arizona increased by -4335. But wait a minute, that is a decrease ! Overall the decrease was 7318. For the Republicans, they also actually decreased by 3702, and Others (mostly Independents) actually increased only by 719.
So Status Quo prevails. Sigh - I was hoping to see evidence of an Obama For America Voter Registration Drive surge by now.
But is that wily Romney Arizona Campaign Chair/Totally Independent Pandered to Birthers Secretary of State Ken Bennett taking voters off the rolls faster than OFA can put them on ? Unfortunately I wont be able to tell that until after the end of July... as they did not release the number of "inactive voters" in the April stats... only in the June 2012 stats.
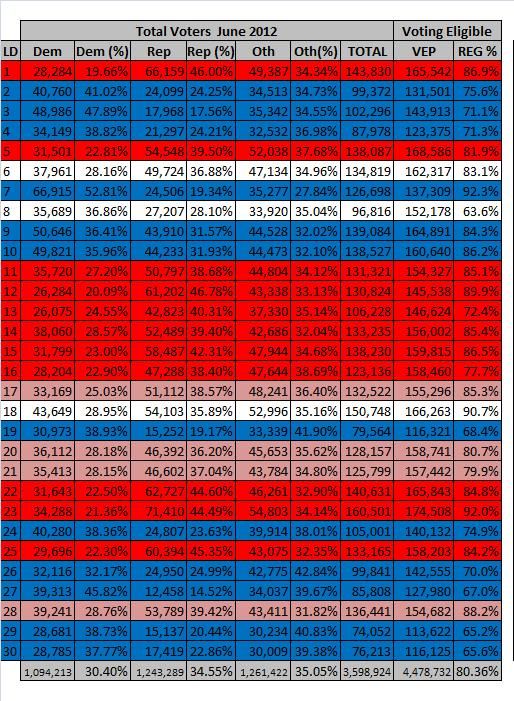
Essentially the Democrats made gains in 7 LDs including four safely Democratic Phoenix LDs, and the GOP leaning 28th. There is big gains in the competitive Flagstaff based 6th LD, but these are outweighed by monster GOP gains with the 6th LD being unusually strong for them (an extra 1000 registered GOP voters).
Here is the table showing by Legislative District the increase or decrease in active voters from April to June 2012. (D=Dem, R-GOP, O=Others incl Independents,T=Total).
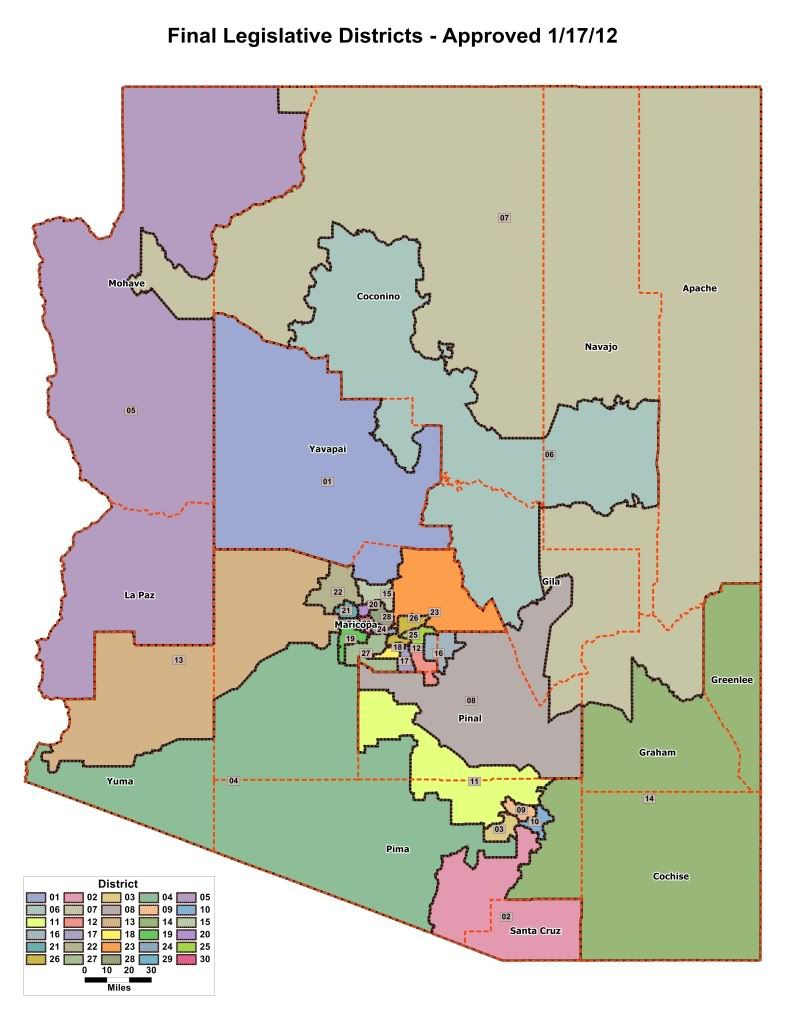
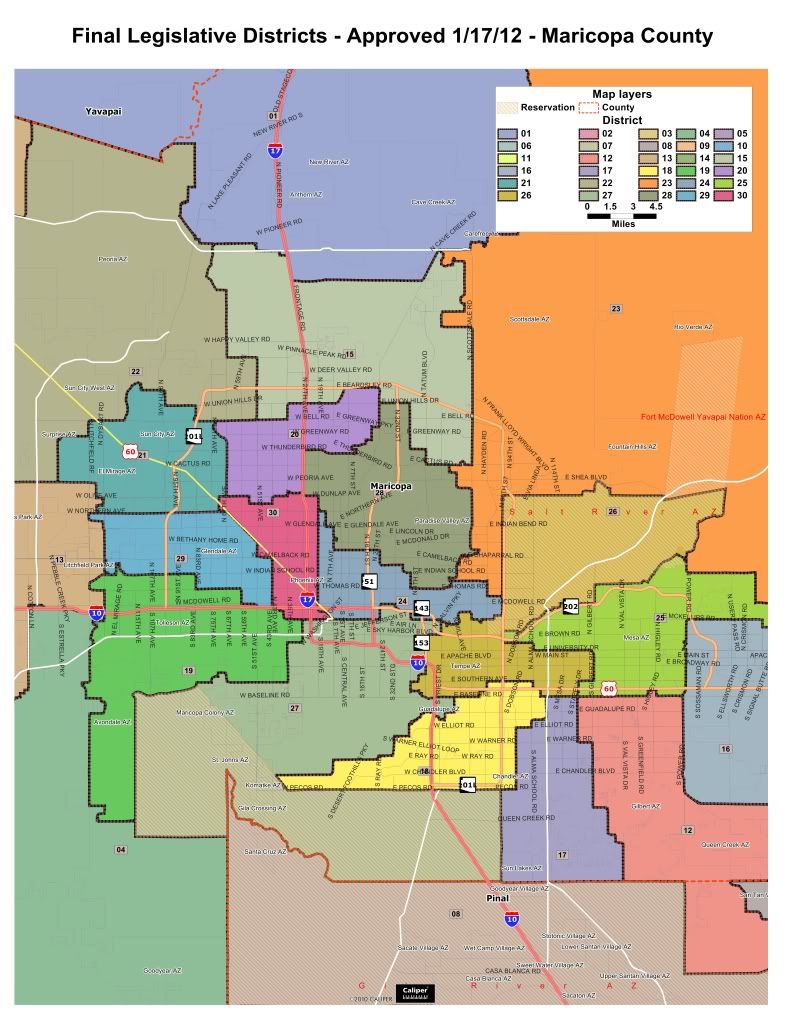
If you have forgotton which LD is which these maps may help.
Here is the Independent Redistricting Commission's Arizona LD Map
Here is the Independent Redistricting Commission's Phoenix LD Map
Conclusions
-We are still going backwards overall.
- We need more data to identify how many voters are being made "inactive voters" by Ken Bennett.
- Inactive Voters are around 10% of the Voting Eligible Population in general (see tables below for details).
- There are three Tucson Democratic LDs (3rd, 9th and 10th) with greater than 17% of the Voting Eligible Population being "Inactive Voters" (See tables below for details).
Questions
- How many voters has OFA actually registered ? This would be useful in determining whether there is funny business with the stats. and voters being made inactive.
- Why do the Baja Arizonans, particularly the Democratic seats in Tucson have far more "inactive" voters ?
For my spreadsheets with the full numbers, please see below the fold.
Please vote in the poll.
Arizona Registration - By The Numbers
When looking through the below tables remember it is tough to compare apples with apples here... The April 2012 numbers were the first using the new Legislative Districts (LDs) and they only had ACTIVE Voters, whereas the June 2012 numbers had the full list of Active Voters and Inactive Voters (which are those voters for whom voting is made unnecessarily hard and who are at risk of being pushed off the rolls altogether).
The Voting Eligible Population is my calculation created by using the Hispanic CVAP figures. The colour coding reflects the Democratic seats (blue), the competitive seats (white), the GOP leaning seats (pink), and the Solid GOP seats (red).
Table 1: April 2012 ACTIVE Registered Voters
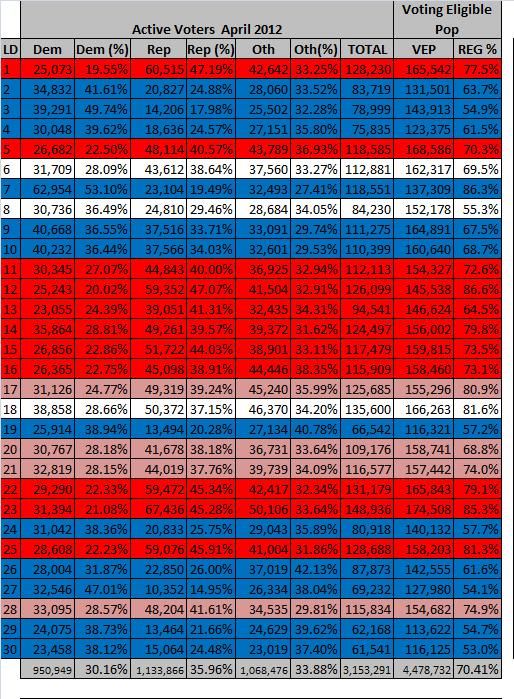
Table 2: June 2012 ACTIVE Registered Voters
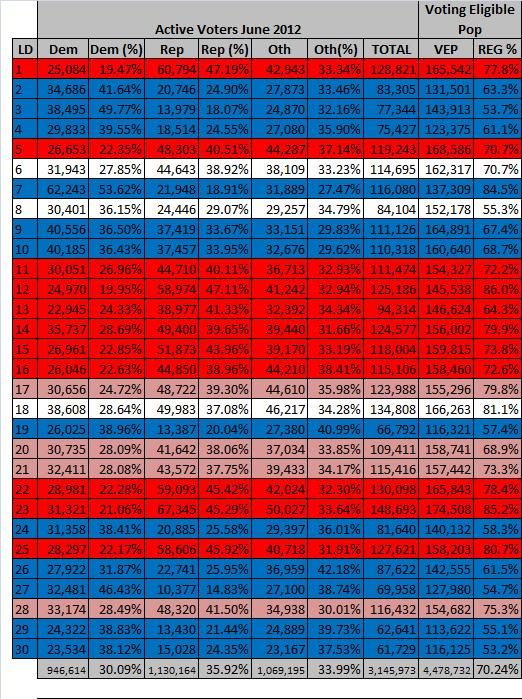
Table 3: June 2012 INACTIVE Registered Voters
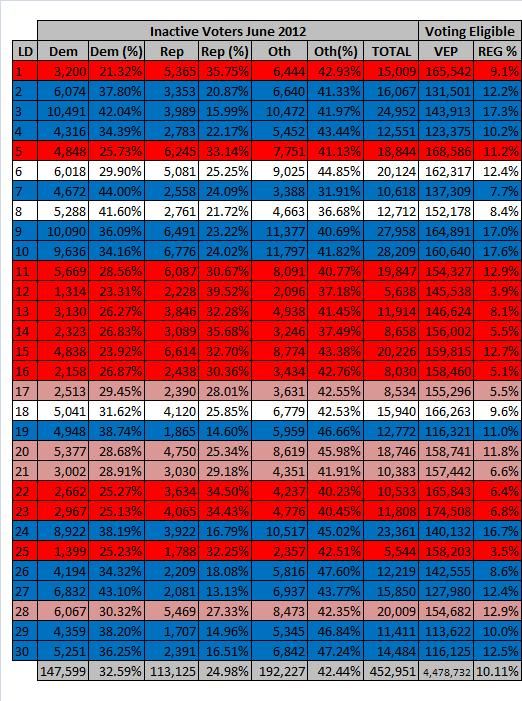
Table 4: June 2012 TOTAL Registered Voters
