When I was studying at Valparaiso University, one of the professors commented that only two alumni in the department's history went on to graduate school to study anticyclones. That's because anticyclones are usually boring. They usually produce unremarkable weather. Outside the Aleutian Islands, few people remember ten straight days of sunny weather.
The last few weeks though, an unusually persistent anticyclone have pushed L/I/P and even Mel Gibson's traffic stop out of the headlines.
More below the fold.
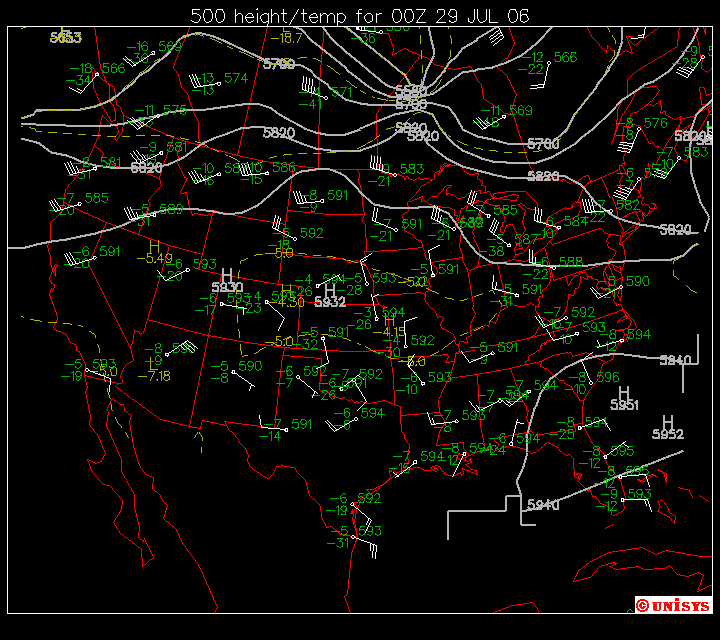
Below is the 500 mb map from 7 pm CDT, July 28.

Note the "H" in Nebraska. More to the point, notice the (roughly) clockwise circulation around it; the flags point into the wind like a reverse weathervane.
Since sea-level atmospheric pressure is around 1000 mb, the 500 mb map shows an approximate height where half the atmosphere lies above, and half lies below. Over Kansas, the 500 mb level was around 5,940 meters.
The warmer the atmosphere, the higher the 500-mb level.
Now, is the heat wave unusual or widespread?
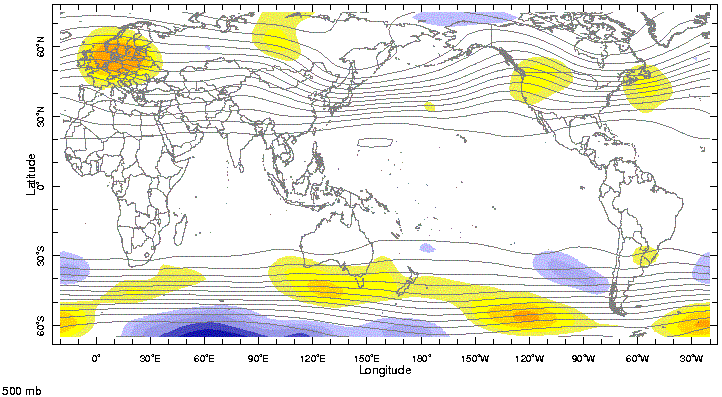
Here are the 500 mb height anomalies for July. (NCEP data from Columbia University's site)

Of note are the high anomalies over northwestern Europe and the Pacific Northwest. Also, note the near-complete lack of low anomalies over the Northern Hemisphere. This would indicate a warm July over the lower atmosphere of the Northern Hemisphere, with more heat waves than cold snaps.
As a rough rule, a 20 m change in 500 mb height represents a 1 C change across the layer. Anomalies below 40 m are not represented on the graph; the 60-80 m anomaly over the Pacific Northwest would represent a 3-4 C increase in temperature across the lower half of the atmosphere.
These are rough rules; please note that the 500 mb height does not say where in the lower atmosphere the extra heating occurred; intense heat near the surface with normal temperatures elsewhere looks like moderately warm air throughout the layer. The first situation would be more likely (though not certain) to spawn severe weather.
So what difference does 3 or 4 C make?
Here are the preliminary July 2006 anomalies for various American cities where the heat wave made headlines.
Data supplied by the National Weather Service
Chicago, IL: +3.2 F
St. Louis, MO: +2.2 F
Minneapolis, MN: +6.5 F
Denver, CO: +2.8 F
Seattle, WA: +2.2 F
Portland, OR: +3.1 F
San Francisco, CA: +3.0 F (Airport)
Los Angeles, CA: +5.0 F (Airport)
Los Angeles, CA: +5.7 F (Downtown)
Pierre, SD: +6.0 F
Note that only three cities exceeded normal by more than 3 C, and not even Pierre with 117 on July 15 and 111 on July 29, 30 and 31 exceeded normal by 4 C. The rest of these cities did not even exceed the normal by 2 C.
Chicagoans now know that a 1.2 C rise is not trivial.
You probably notice that the 500 mb heights and surface temperatures show only moderate correspondence. California's heatwave can possibly be blamed on an unusually warm Pacific Ocean and winds blowing off the deserts instead of off the Pacific. Minneapolis saw lots of severe weather, which would indicate a warm surface and colder temperatures aloft. (I don't know about South Dakota) We can't tell from the graph above exactly what the height anomalies over Chicago, St. Louis, Denver were, but the graph would look the same over them if the 20 m = 1 C rule was absolute and certain.
So stay cool. If you are in the Midwest, take full advantage of the upcoming break in the heat since the 6-10 day and 8-14 day forecasts call for unusually strong chances of warm weather over Flyover-land. Of course, Chris may change everything early next week.
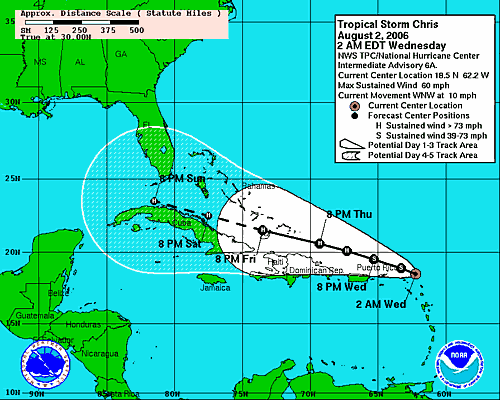
Tropical Storm Chris
Tropical Storm Chris is expected to intensify as it tracks WNW just north of Cuba and Hispaniola. The ridge/anticyclone is expected to redevelop eastward as Chris approaches the CONUS and guide the storm through the Florida Strait into the Gulf of Mexico as a minimal hurricane, possibly lashing the Keys and S Florida with its outer bands. Fortunately for the Gulf Coast, water temperatures are near 30 C, not the 32 C seen last year as Katrina came through.


