In an interview with with Paul Krugman last week, ABC news reported:
"I would not be surprised if the official end of the U.S. recession ends up being, in retrospect, dated sometime this summer," he said June 8 during a lecture in London.
However, Krugman argues people didn't listen to his entire speech, which included dire predictions about lingering unemployment.
"There's a big difference between the end of a recession, which is really only when some things start to turn up, and the return to prosperity," Krugman told ABC News. "I think what people don't get is the difference between the end of a recession in a technical sense and actual recovery, which matters to people."
In my opinion, Krugman has it exactly correct. I explain why in detail, and address the biggest threat of a continuing downturn with the need for immediate action on one front by the Obama Administration, below.
In this "Big Picture" look at the economy as of Independence Day 2009, I will argue that:
1. Right now, production and consumption in the economy are stabilizing, but job losses and unemployment continue to accumulate at an alarming level, with wages perilously poised to enter deflation soon if matters don't turn around quickly.
2. Three out of the five long term imbalances in the economy have made great strides toward an improved equilibrium, completing most of the necessary adjustment. On of the other two is improving temporarily, but probably not in the long term yet. The final one is as bad or worse than before the Recession began.
3. Despite much bad current news, and in particular the poor jobs report on Friday, Leading Economic Indicators will most likely have their third month in a row of substantial gains for June when reported later this month, suggesting that the Recession will bottom around Labor Day, give or take 2 months. A second long-established and highly-regarded private source suggests recovery is imminent, while a Third suggests renewed weakness.
4. The biggest threat to the beginning of GDP growth and a decrease in the misery of average Americans is the "Fifty Little Hoovers" of balanced state budgets, and in particular the disaster that is California. There is one specific policy that I believe the Obama Administration should enact and implement immediately.
I. The Recession right now: some stabilization, some continued severe contraction:
Nouriel Roubini, most famously, declared some time ago that this would be an "L" shaped recession, by which he meant there would be a precipitous decline after which there would be no improvement, but continued low activity. There are a host of graphs that demonstrate that the we are currently in an "L" of a recession. For example, on the consumer side, here is a graph of real (i.e., adjusted for inflation) retail sales, showing that the downturn ended at the end of last year, but there has been no meaningful improvement since:
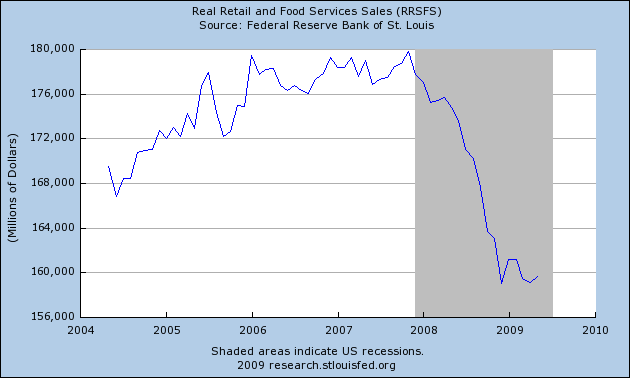
Notice that the steep decline of late last year, plus the recent stabilization, form an "L" in the graph. Here are some more "L"'s:
It looks like car sales have found a bottom too, but again no meaningful improvement:
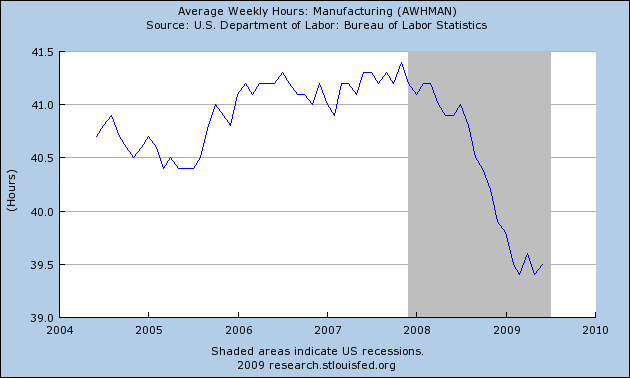
So have 5 of the 10 statistics that make up the index of Leading Economic Indicators:
Average hours worked in manufacturing is the most important, making up 25% of the weight of the index:
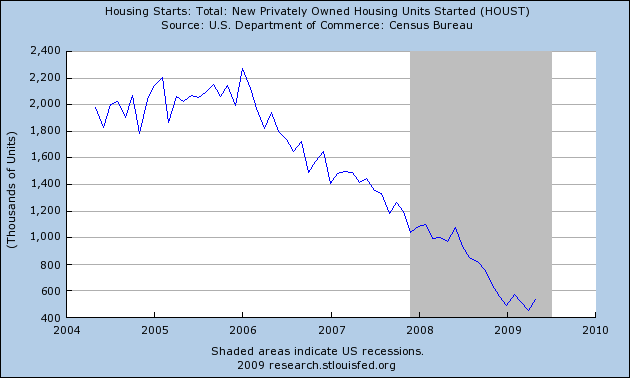
Housing starts and permits have stabilized at least for the last few months also:
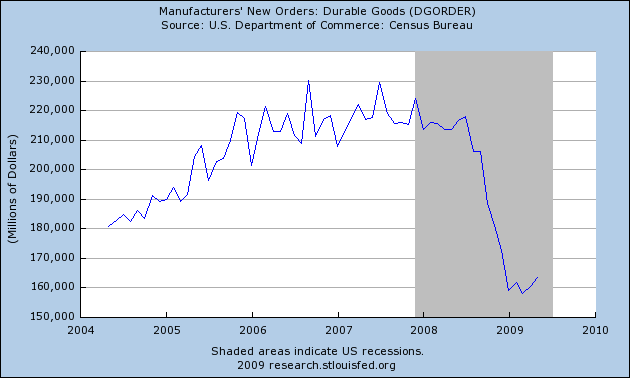
So have manufacturers' new orders for durable goods:
So have manufacturers' new orders for nondurable consumer goods:
So has the ISM's index of manufacturing supplies:
(note: the ISM is a "diffusion" index, meaning readings below 50 are declines. Note the steep declines last year, with readings right at 50 in the last couple of months).
If manufacturing and consumer consumption appear to have stabilized in the last few months, employment and wages continue to terrify:
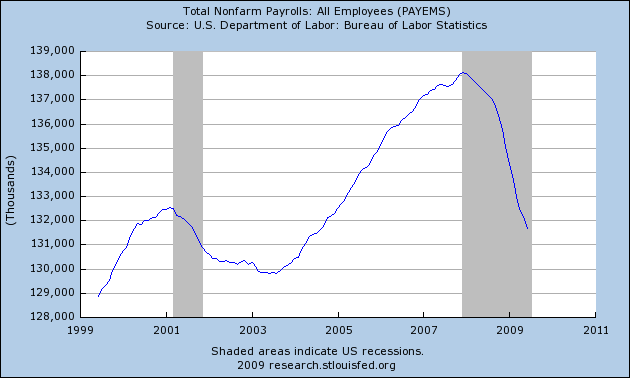
Almost an entire decade of job growth has already been destroyed by this recession:
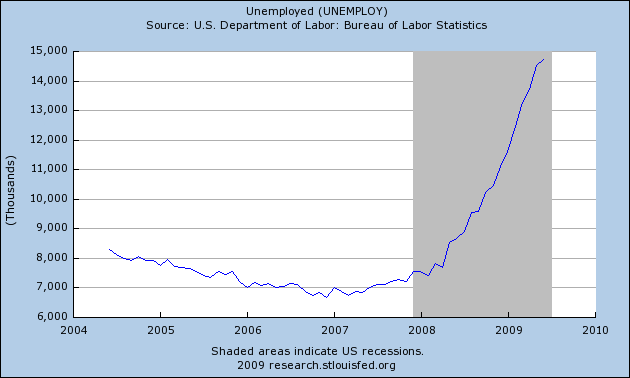
The number of unemployed workers continues to rise:
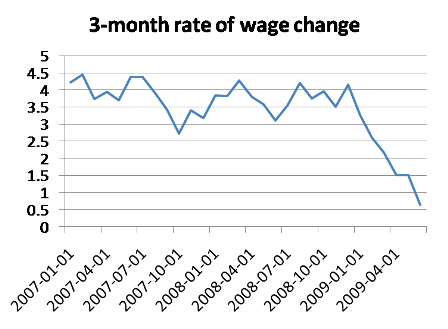
Wages have grown at the paltry rate of about 2.5% in the last year. Worse, wages have totally stagnated in the last few months. Continuing at this trend will mean actual wage deflation within a year:
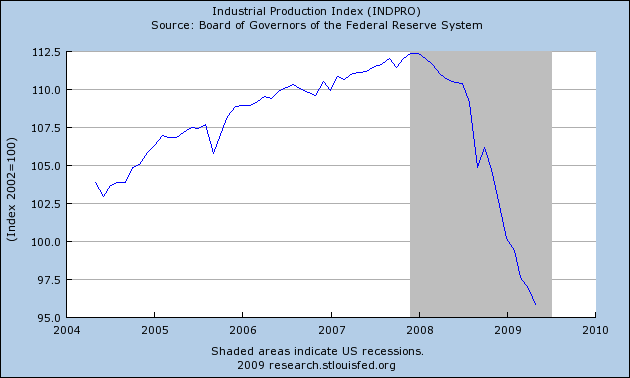
And industrial production, a classic marker of expansions and recessions, continues to decline:
In summary, the free fall has completely stopped for part of the economy, but not at all for the part that is crucial to the well-being of average Americans.
II. The Recession is at least bringing about the necessary readjustment in 3 of the 5 long-term economic imbalances
We are going through a very painful period. But at very least there is the silver lining that usual market forces are working to rectify some very long-term unsustainable imbalances about which many have warned for several decades.
1. Housing prices are returning to their normal long-term equilibrium as indicated in this update graph covering 100+ years of home prices (h/t Stever Barry via Barry Ritholtz):
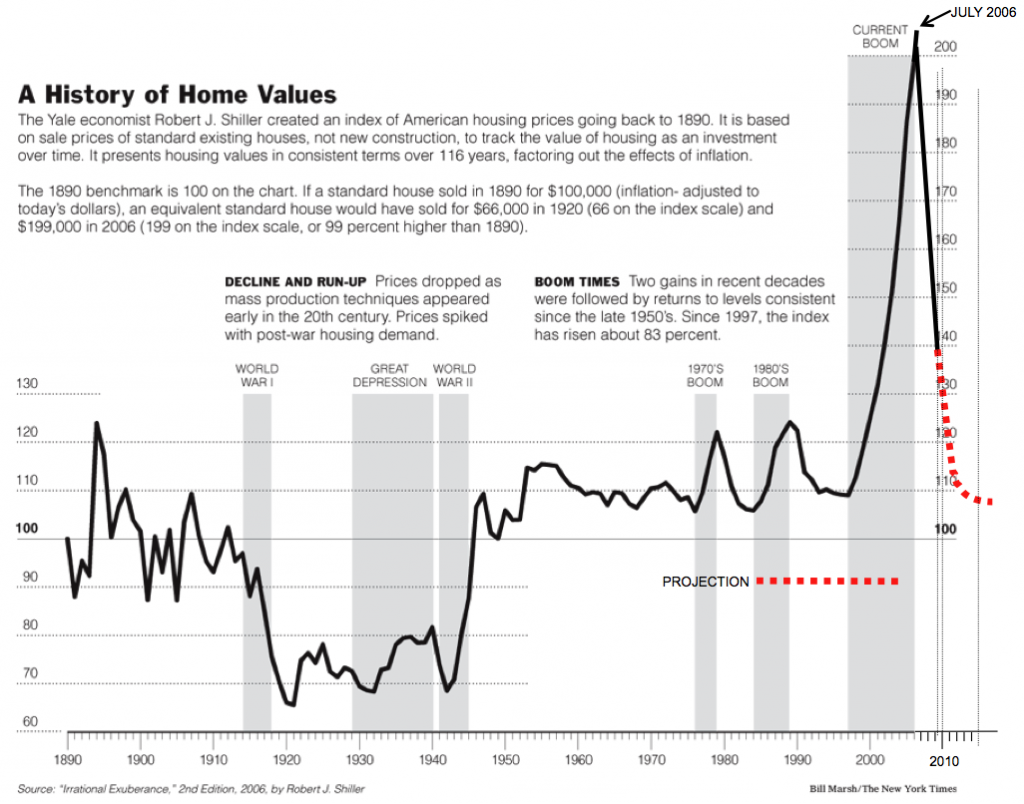
Affordability metrics have never been more favorable. The "Housing Affordability Index divides the price of the median house with that of a regular 20% down mortgage available to a household with the median income):

As Bonddad says, "Housing is Nowhere Near a Bottom" at least in price, but the bust is working through the problem.
2. The mirror image for the declines of consumption graphed in Part I above is the household savings rate. This had been at 0% during the last few years, but has abruptly increased to nearly 7% as of last month:
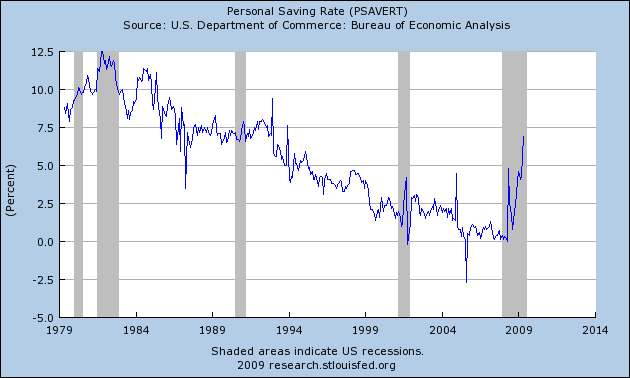
This is about 3/4 of the way to the normal, pre-bubble rate of 8%-9%. There is undoubtedly some further rebalancing to go, but most of the adjustment here has already been made by consumers. This bodes well for a pick-up of consumption if it is sustained and if consumers gain more confidence about the future.
3. The trade deficit has shrunk dramatically. The two biggest imbalances in the deficit have been Oil and China. Both of these still exist, but both have shrunk, as shown by this graph:
Of all of the deficits, the trade deficit is the one that is most crucial, as it acts as a drain on the entire US economy, transfering wealth from us to China and Petrosheikhdoms. Much more needs to be done here, but at least market forces are working the way they are supposed to.
If the above three imbalances are shrinking, two others are problematical, and one of them has been exacerbated in a way that is dangerous to our future if not properly addressed as soon as circumstances permit:
4. In 2006 the Congressional Budget Office reported record disparity in incomes: 
Typically in a recession, the stock and housing portfolios of the wealthy have been hard hit, temporarily reducing that inequality as shown in the below graph showing the effects of the 2001 recession:

There is every reason to believe that the same reduction has taken place in this recession -- a dreary reduction of inequality solely because wealth across the board has declined, but relatively moreso for the wealthiest -- but as recent record payouts at Goldman Sachs demonstrate, CEO and financial sector pay continues to be a blight of inequity on our society.
5. Finally, the deficit and the national debt have exploded.

While this may be a temporary necessity as a response to near-depression like circumstances, we are running out of room, as the Chinese attempts to relegate the dollar to former reserve currency status are showing. If all of the stimulus and bailout money goes to waste, or to Wall Street, we will have spent our way into a long-term spiral of Latin American style decline. Paul Krugman has argued that it is important not to return to balanced budgets too soon, but certainly once the danger has passed, this must be a very high priority. If it is not done, the next 30 years will likely see a slow inexorable climb in interest rates choking off any meaningful economic growth.
III. Despite the continued gloomy employment and unemployment data, Leading Economic Indicators still look poised for expansion
The Index of Leading Economic Indicators, with a 5 decade history, was formerly kept by the Commerce Department until its computation and makeup was outsourced to the Conference Board about a decade ago. The 10 indicators, with the weights given each indicator, are as follows:
- real money supply (35%)
- average weekly manufacturing hours (25%)
- interest rate spread (10%)
- manufacturers' new orders for consumer goods (8%)
- supplier deliveries (7%)
- stock prices (4%)
- consumer expectations (3%)
- building permits (3%)
- average weekly initial claims for unemployment insurance (inverted) (3%)
- manufacturers' new orders for durable goods (2%)
In April and May, the LEI surged more than 1% a month, coming within striking distance of breaking even year over year.
Although June's number won't be reported for several more weeks, we already know what by weight over 90% of the above will be! Real money supply was very strong at the end of last year, and generally has continued to grow slowly as the Fed continues to re-liquify (or re-solvenc-fy) the banking system. We won't know for sure until June's inflation report is in, but most likely this will be slightly positive. Given the uncertainty, I will count this as a neutral. Average weekly manufacturing hours, which had been dropping like a lead weight earlier this year, as reported above in Part I have stabilized and actually went up slightly in June. The yield curve is even more strongly positive than before, due to the backup in long term rates while short term rates are still essentially 0%. Manufacturers' new orders for non-consumer goods increased significantly as of the last report (which will actually revise May's report higher). Supplier deliveries as measured by the ISM continued to increase slightly. Stock prices (over the last 90 days) are still up, although not as strongly as last month. Consumer expectations about the future as measured by the U. of Michigan sentiment survey have gone sideways, decreasing slightly in June. Average initial claims for unemployment insurance were basically flat for the month, but the June average was a slight decline since May (fewer new claims is good). Manufacturers' new orders for durable goods were reported as surprisingly and sharply higher a couple of weeks ago (which should also revise May's report higher).
By weight, that's 55% positive, 35% neutral, and 7% negative. (Building permits, at 3%, haven't been reported). If I had to guess, right now it looks like June's LEI will be reported at ~ +0.8%. That will be three straight months of positive LEI, the traditional signal that GDP growth is very near at hand. If LEI simply go sideways for the next couple of months, the very bad readings of July and August 2008 will be replaced and year-over-year LEI will be positive. For that reason I believe that it remains the most likely outcome that the Recession will officially have hit bottom at about Labor Day (give or take a couple of months).
There are two other Indeces of future business condition indicators. On of them, the Economic Cycle Research Institute, has a history and database of over 100 years (meaning their reports cover the Great Depression and other deflationary busts before it). Here is their most recent report, as of last week:
A gauge of future U.S. economic growth stood unchanged in the latest week but its yearly growth rate climbed to an almost two-year high, reaffirming hopes that the grips of deep recession are loosening, a research group said on Friday.
The Economic Cycle Research Institute['s] ... annualized growth rate, which finally entered positive territory last week, spiked to just under a two-year high of 4.0 percent from its previous rate of 2.1 percent.
It was the growth rate gauge's highest yearly reading since the week ended Aug. 3, 2007, when it stood at 4.3 percent, bringing a solid end to its 22-month stretch in the red.
The other report, from the Philadelphia Fed, ijs a mixed leading/coincident index meant to reflect on-the-ground business conditions. This index was sharply revised, not just for the last week or month, but almost 4 months (which doesn't really make it "leading" anymore) based primarily on the July payroll data:
Here is how it looked as of Friday:

Per the Philly Fed, the Friday payroll number was entirely responsible for the downturn at the end.
Here is how it looked only a week before:
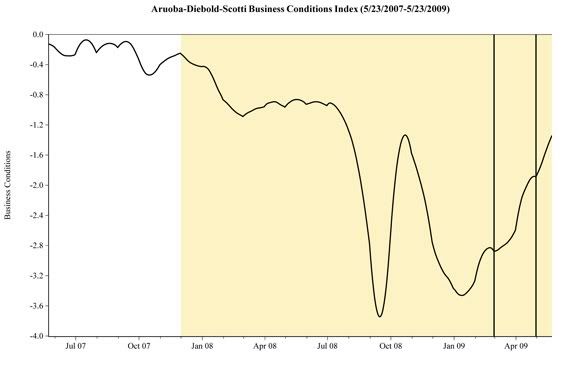
Needless to say, Friday's jobs report and the continuing new jobless claims are weighing heavy on this index. It is impossible to imagine any upturn beginning with 600,000 new unemployment claims week after week and 400,000 job losses a month. Which brings us to ....
IV. The Federal Government must intervene to Rescue the States, in a morally responsible way
By far, the biggest threat to a bottom being put in to this Recession, is the continuing drumbeat of new layoffs. Thursday's June employment figures over - 450,000 and new jobless claims that have stubbornly, week after week, remained above 600,000, put the kibosh on any idea that the bottom is already here. We simply cannot stand 600,000 people putting in for jobless benefits, week after week after week. And the source of the continuing drumbeat of jobs lost appears to be coming more from anywhere else from the location of what Paul Krugman has called the "50 little Hoovers", i.e., the state (and municipal) governments, which are obliged to balance their budgets and so must throw employees out of work and cut back on spending projects, exactly when they are needed most. Part of the stimulus plan was to ameliorate this, of course, but more must be done if the renewed government layoffs are not to thwart any hoped-for turnaround. Unemployment, of course, is a lagging indicator of GDP growth, but if a renewed vicious round of layoffs causes consumers to renew their panicky, hunker-down mentality from late last year, then the economy will take just as big as a renewed hit as was so destructive and contractionary to the economy then. We may already be beginning to see that retrenchment in consumer confidence as related in last week's downturn of that series for the first time in a number of months:
It is true that some states, most notably California, overspent during the good times, and relied on ephemeral bubble-fed sources of revenue. And California in particular is the poster-child for an ill-thought-out fiscal straightjacket that has already driven it to the point of fiscal collapse. It would be the height of rewarding moral hazard if taxpayers in states that played it relatively safe had to bail out taxpayers in spendthrift states. And while there are some interesting ideas for reforming state revenue sources to try to avoid this situation in the future, that doesn't help us now.
To assist those state governments now, while preventing moral hazard from being created, I propose that Federal budget help should be extended immediately to the states in dire distress who request such assistance, but extended at a substantial cost: namely, that businesses and residents of the states so assisted by the federal government must pay a surtax on the Federal taxes once their states are in economic recovery. If California needs $30 Billion, but North Dakota has a surplus, then there is no reason for North Dakotans' taxes to increase. But on the other hand, in return for federal assistance, then there must be payments equalling, say, $10 billion a year for 3 years from those individuals and businesses in California who have been bailed out, once their state is undergoing economic recovery. I see no logistical reason in this day and age of sophisticated computers why the IRS would be unable to make the determination of who is subject to the surcharge, based on residence claimed on this year's tax returns.
Such assistance would help turn the economy around now, avoid a renewed downturn based on a retrenchment of consumer confidence, and avoid moral hazard. It should be passed by the Congress and implemented by the Obama Administration immediately.
