This story may not as big as the current juiciness on Giuliani or other hot topics, but it is part and parcel of the Republican mendacity that saturates our government, down to the lowliest and least effectual agencies around.
This time it's the National Endowment for the Arts and its latest scary, scary report called To Read or Not to Read. The report claims that because Americans are choosing to devote less of their leisure time to reading books, reading proficiency is declining. As reading as a leisure activity declines, the report predicts that many valued forms of civic engagement -- volunteering, voting, and going to museums, for example -- will also decline.
Trouble is, they've cooked the data.
The Endowment's Chairman, Dana Gioia, prefaces the report with an anguished forecast:
To Read or Not To Read confirms—without any serious qualification—the central importance of reading for a prosperous, free society. The data here demonstrate that reading is an irreplaceable activity in developing productive and active adults as well as healthy communities. Whatever the benefits of newer electronic media, they provide no measurable substitute for the intellectual and personal development initiated and sustained by frequent reading.
To Read or Not To Read is not an elegy for the bygone days of print culture, but instead is a call to action—not only for parents, teachers, librarians, writers, and publishers, but also for politicians, business leaders, economists, and social activists. The general decline in reading is not merely a cultural issue, though it has enormous consequences for literature and the other arts. It is a serious national problem. If, at the current pace, America continues to lose the habit of regular reading, the nation will suffer substantial economic, social, and civic setbacks.
The whole argument rests on whether or not reading proficiency has declined. To make its case, the researchers at the Endowment have to massage the data. Here are two egregious examples of their technique.
The graph below shows the original data as it is displayed on the NCES web site with the NEA's truncated and reformatted version superimposed above the original:
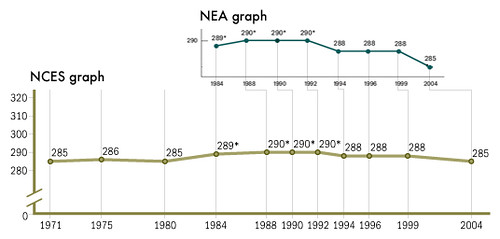
Although the data represented in the NEA version are strictly speaking accurate, they nevertheless seriously distort the data set from which they were derived in two key ways: by truncating the data set and by representing irregular time intervals with regularized spatial intervals. The first distortion creates a trend where none exists. The second distortion magnifies the effect of the decline in scores by making the slope of the line between the scores in 1999 and the scores in 2004 steeper than it should be. The steeper slope, then, suggests a more rapid and deeper decline than the underlying data support.
Note that the NEA graph begins with the year 1984 while the data set from NCES begins in 1971. Note too that the average scale score for 17 year olds in 2004 — 285 — is exactly the same as the average scale score for that age group in 1971. In other words, over the whole period for which data are available, there has been no change in reading proficiency among 17 year olds, although there was evidently a brief period of significant improvement between 1984 and 1992 (the asterisks mark statistically significant differences with the 2004 score). In short, there is no downward trend in reading proficiency over the whole period for which we have data. The downturn that did occur after scores peaked from 1988 through 1992 is statistically significant but it is on the whole not very steep nor particularly precipitous. In fact the magnitude and duration of the decline mirror the statistically significant uptick in scores over the four year period from 1980 to 1984.
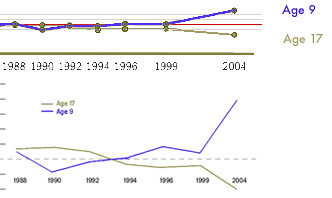
A second graph produced by the NEA and used both in the executive summary and in Chapter 5 of the report highlights and magnifies both kinds of distortions. The graph uses a truncated set of the NCES data for two age groups — 17 year old students and 9 year old students — to exaggerate the difference in trends between the two groups. The underlying data are represented on the NCES graph at the top of the illustration. The green dots and line represent the relative changes in scores for 17 year olds from 1988 to 2004 and the blue line represents the relative changes for 9 year olds. The horizontal red line is the base 1988 score for each group. The 9 year old groups' score is 7 points higher in 2004 than it was in 1988 while the 17 year old groups' score is 5 points lower. In the NEA graph for these same data, the scale has been altered to create the impression that score differences are much greater than they actually are. The dramatic improvement in the scores of 9 year old readers is statistically significant, as is the 5 point decline in scores for 17 year olds over the period shown in the graphs. Yet in the NEA revision of the NCES graph, the data points for each test year are spaced evenly across the x-axis even though the tests occurred at uneven intervals. As a result, the changes in scores for both groups are made to seem much more dramatic and sudden than they really are.
The NEA report shows other serious problems with both the data presented and the argument the data are being massaged to support, but suffice it to say that intellectual dishonesty -- the same sort of junk science we've seen on climate change, environmental issues, and the presence of WMD in Iraq -- is at work here. We need to call them on it, every time.
