This is posted in its entirety from my blog.
I've written two articles titled Is a Bear Market Developing and Is a Bear Market Developing Pt. II, where I outlined my thesis that the securities markets were looking more and more like they were forming a bear market.
Today I am making my analysis official. The US securities markets are in a Bear market.
Here are the reasons I am making this call. Let's start with the chart that first caused me concern.

In late 2007, the Russell 2000 broke a 4 year long uptrend. Because the Russell 2000 is composed of small cap stocks whose share prices increase in a growing economy this index is a good indicator of trader's overall risk appetite. In addition, the longer the trend, the more important its violation. When this index dropped through is four year uptrend it indicated a major change in investor sentiment regarding risk. This move said traders were no longer betting on a growing economy and were re-adjusting their portfolios accordingly.
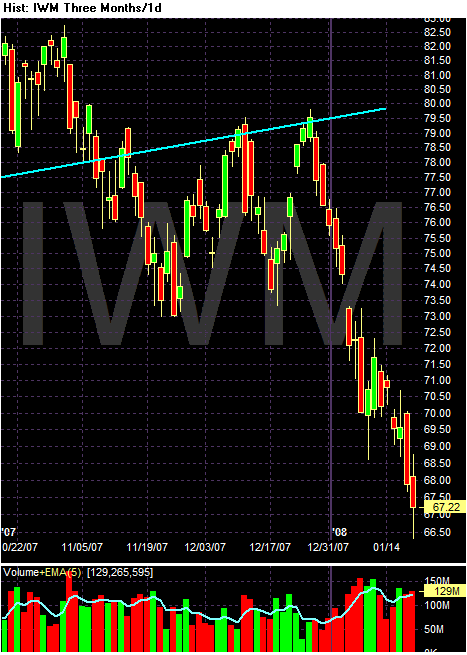
Here's the second chart that caused me concern. The blue line is the 4-year uptrend from the previous graph. Notice that since the Russell 2000 broke this trend line it has twice rallied to the trend line only to be rebuffed. In other words, support has now become technical resistance.
Let's add some more charts to the analysis.
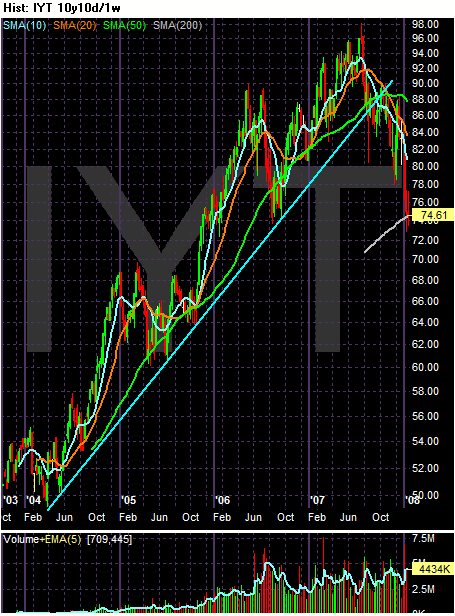
Dow Theory is deceptively simple. It states the Dow Transport average must confirm a broader market advance. The underlying reasoning is wonderfully simple. If the economy is expanding then people and businesses will have to ship more and more stuff from point A to point B. The converse is also true. If the economy is contracting then people and business will have to ship less and less stuff.
The Transport average broke a three and a half year uptrend in mid-2007. It has continued to sell-off since then. It is now down 22% since its mid-2007 peak.
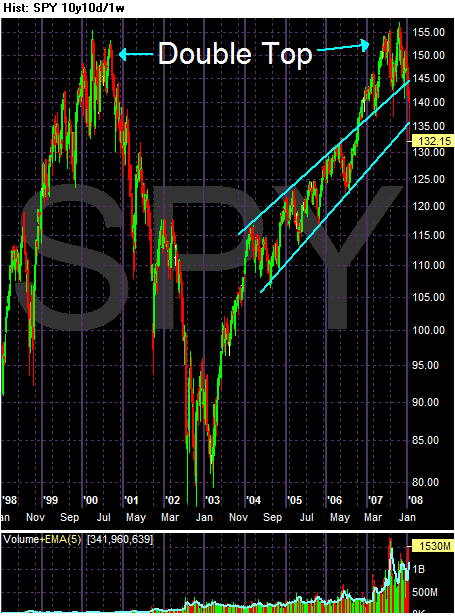
This is a 10-year chart of the SPYs. Notice the index has formed a clear double top that spans the period of 7 years. Also note the heavy volume that accompanies the second top which is probably a buying climax. However, what's important to remember is the 10-year double top formation.
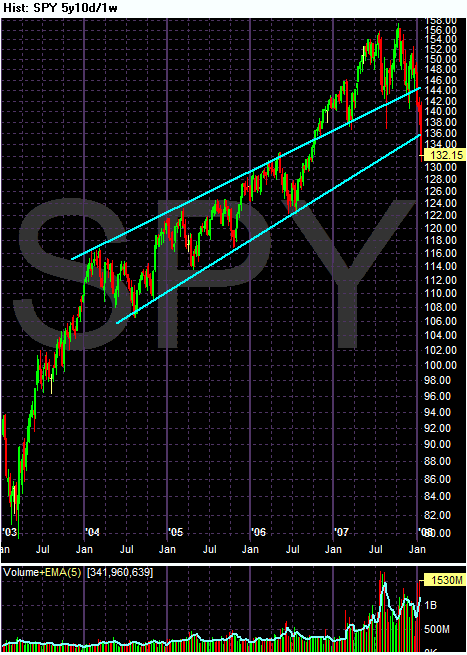
Here is a 5-year chart of the SPYs. Notice the upward sloping channel for the SPYs that has existed since the beginning of 2004. Most importantly, notice how the index dropped through both of these trend lines since the beginning of the year on extremely heavy volume. Here is a closer look of the most recent price action in a weekly chart.
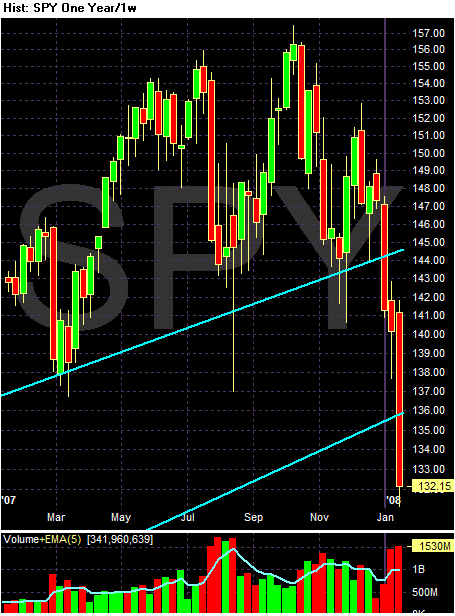
Notice the severity of the price drop and the accompanying volume. Simply put, traders are dumping index shares at an accelerated and heavy rate.
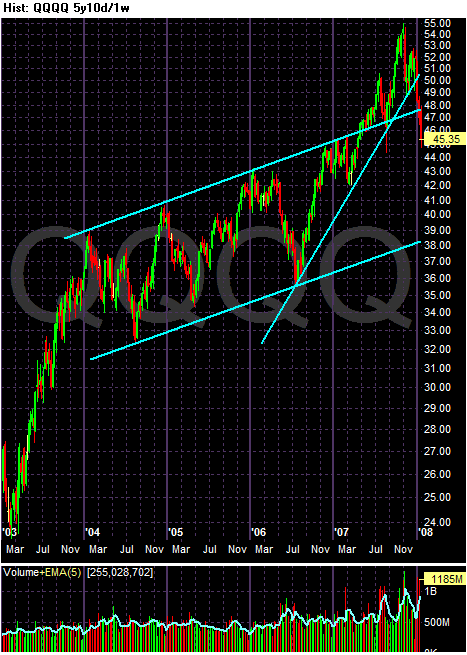
Above is a 5-year chart of the QQQQs. Notice this index had two primary trends in place.
-- The first was an upward sloping channel that started at the beginning of 2004.
-- The second was an upward sloping trend line that started in mid-2006.
Look closely at the chart and notice the following.
-- The index has clearly broken the upward sloping channel that started in mid-2006.
-- The index has clearly broken the upper channel line started in 2004.
-- Both of these moves came on heavy volume.
Let's consider the extent of the damage from the sell-offs:
The S&P 500 ended the week down 76, or 5.4%, to 1325, and has pulled back 15% since Oct. 9. The Nasdaq Composite Index gave up 100, or 4.1%, to 2340, and is 18% off its October high. The Russell 2000 Index of small stocks fell 31, or 4.5%, to 673. Its 21% drop since July 13 puts it officially in bear-market territory.
Notice how the depth of the sell-offs are directly related to the risk profile of the particular index. The Russell is off the most, followed by the NASDAQ and then the S&P. Also note the severity of the sell-off; this is not a garden variety 5% downside move that smokes out the weaker market players. Instead, this is a very substantial move.
Let's look at the final pieces that have led to my conclusion that we are now in a bear market.
First, let's start with two charts: the ETF for the 7-10 year Treasuries and the ETF for the 20+ year Treasury market.
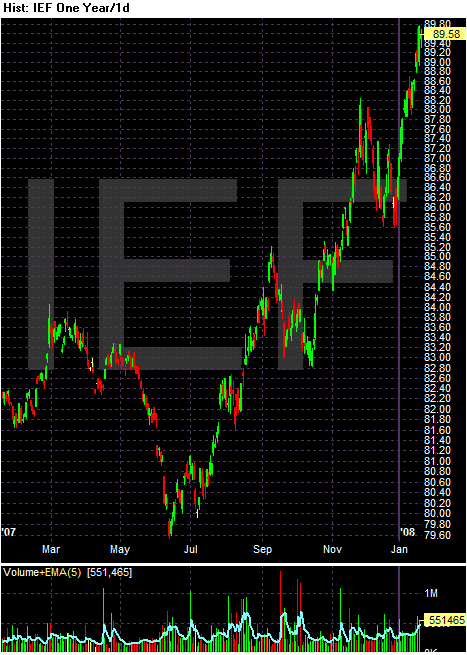
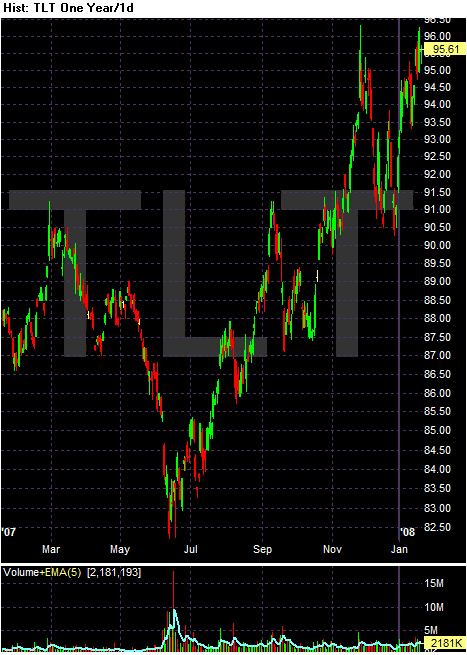
Both markets are still rallying.
Now, let's look at the yield curve.
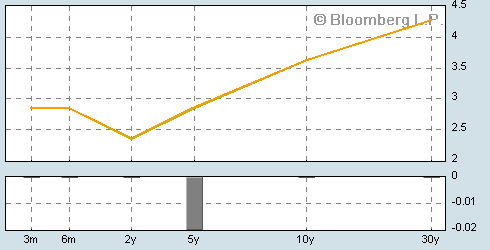
And most importantly, let's look at overall inflation.
The Consumer Price Index for All Urban Consumers (CPI-U) decreased 0.1 percent in December before seasonal adjustment, the Bureau of Labor Statistics of the U.S. Department of Labor reported today. The December level of 210.036 (1982-84=100) was 4.1 percent higher than in December 2006.
According to Bloomberg, the 10-year note is yielding 3.63%, 47 basis points below the prevailing yearly increase in inflation. The 30-year Treasury is yielding 4.28%, meaning 30-year investors are making 18 basis points after adjusting for inflation. In short, inflation is making Treasury market investments a losing proposition yet they continue to rally. This means that capital preservation is the primary concern of bond traders right now, which further indicates there is a great deal of concern out there in trader land regarding the markets and the economy as a whole. When investors continue to buy a security even though it no longer has a meaningful rate of return, there is clearly trouble and deep concern among investors.
So let's sum up:
1.) All of the major indexes have broken key long-term support lines.
2.) All of the major indexes have sold-off considerably since their mid-summer highs.
3.) Volume on the sell-off has been high.
4.) Treasuries continue to rally despite having a negative rate of return or a barely breaking even rate of return, indicating safety is the primary driver of the trade.
We can get into a debate about what exactly constitutes a bear market in terms of the overall sell-off. While these are nice academic debates, we also have to look at the facts at hand. And the facts above are very clear. Each equity index has broken through major trend lines and safety of capital is now the driving force behind trading. The major indexes have all sold-off at least 15% since their mid-summer highs. This is a bear market, plain and simple.
Update [2008-1-22 8:50:5 by bonddad]::Here's the Fed statement:
The Federal Open Market Committee has decided to lower its target for the federal funds rate 75 basis points to 3-1/2 percent.
The Committee took this action in view of a weakening of the economic outlook and increasing downside risks to growth. While strains in short-term funding markets have eased somewhat, broader financial market conditions have continued to deteriorate and credit has tightened further for some businesses and households. Moreover, incoming information indicates a deepening of the housing contraction as well as some softening in labor markets.
The Committee expects inflation to moderate in coming quarters, but it will be necessary to continue to monitor inflation developments carefully.
Appreciable downside risks to growth remain. The Committee will continue to assess the effects of financial and other developments on economic prospects and will act in a timely manner as needed to address those risks.
Voting for the FOMC monetary policy action were: Ben S. Bernanke, Chairman; Timothy F. Geithner, Vice Chairman; Charles L. Evans; Thomas M. Hoenig; Donald L. Kohn; Randall S. Kroszner; Eric S. Rosengren; and Kevin M. Warsh. Voting against was William Poole, who did not believe that current conditions justified policy action before the regularly scheduled meeting next week. Absent and not voting was Frederic S. Mishkin.
In a related action, the Board of Governors approved a 75-basis-point decrease in the discount rate to 4 percent. In taking this action, the Board approved the requests submitted by the Boards of Directors of the Federal Reserve Banks of Chicago and Minneapolis.
Here's what the Federal Reserve should have said: We are Wall Street's bitch and will do exactly what the street wants us to do.
The problem is liquidity isn't the issue -- it's counter-party risk. So long as lenders are
1.) Concerned about getting repaid on existing loans and
2.) Concerned that a party might not repay even a short-term loan
Then loans aren't going to get made. It's that simple. And so long as we are in the middle of writedown hell, lenders loan ability is going to be seriously constricted.
Also note the the effective Fed Funds rate is now negative. The yearly increase in inflation is 4.1% and the Fed Funds rate is now 3%, meaning the effective Federal Funds rate is in fact -1.1%. This is the situation that got us into this mess.
Update [2008-1-22 9:17:28 by bonddad]:: This is a highly fluid situation. For those of you who want to stay on top of the news and developments I would highly recommend Bloomberg television, radio and their website. As a second choice I would choose CNBC. Also, on my blog list to the right are a ton of financial sites that I read on a daily basis -- they all come highly recommended.
