In honor of Hillary Clinton's concession and endorsement today, I've created this animation of the progress of the Democratic presidential primary race:
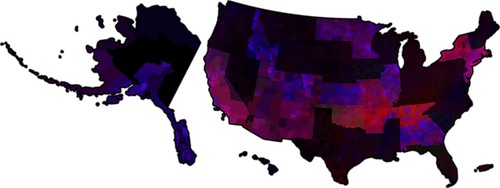
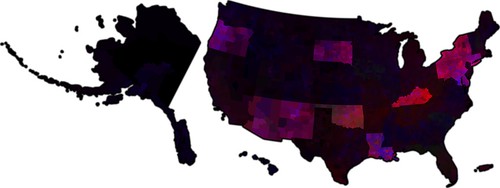
The map I'm using is a weighted map where the brightness of a county represents the percentage of a delegate vote per square mile on a logarithmic scale and the hue of each county is roughly represented by this scale:

With Edwards being green, Obama being blue, and Clinton being red.
The video follows the primaries from Iowa to South Dakota and Montana with one day represented as 0.4 seconds in the animation.
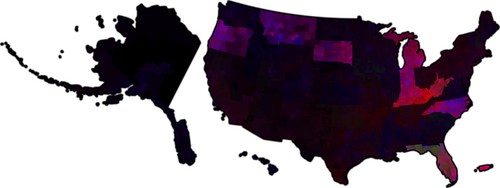
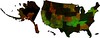
This is the final map:
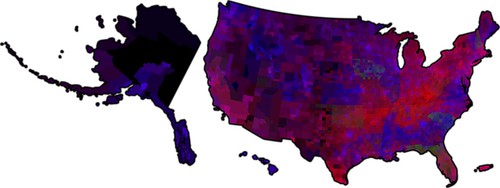
Note that I'm using the county conventions in Iowa and Nevada instead of their caucuses and that Florida and Michigan are given the delegate weight that the RBC gave them on May 31 (full seating with half a vote), even though I am displaying the ratios in Michigan from the primary, which were not used in the actual delegate apportionment.
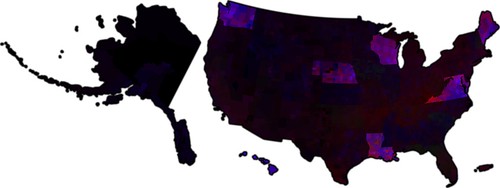
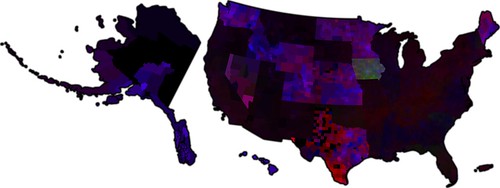
January
The scheduled early states of Iowa, New Hampshire, Nevada, and South Carolina as well as the delinquent states of Michigan and Florida held their primaries in January. I represented Michigan and Florida in the animation by showing them and letting them fade.
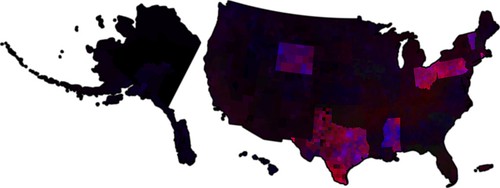
February 5
The day that the media and the Clinton campaign believed would be a decisive day in the primaries. In a way they were right. The split performance on February 5 was the beginning of the end of Clinton's chances of capturing the nomination, largely because of what was to come next.
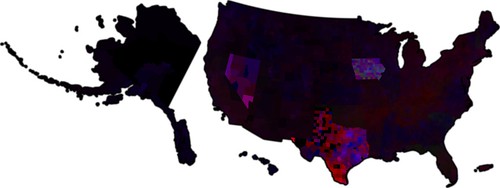
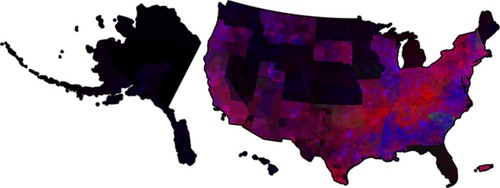
Later February contests
These contests represented the "sweep" the Obama had after February 5. Culminating in Wisconsin and Hawaii, the later contests in February gave Obama the decisive delegate lead that would carry him through the rest of the process.
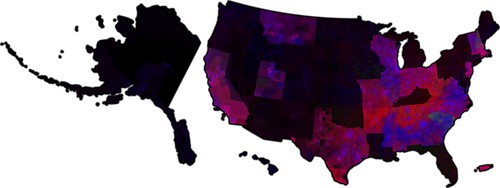
March and April
March was a mixed bag. While Clinton scored some wins on March 4, they were not enough to recover from Obama's February performance, essentially sealing her fate. But the theater continued through the Obama wins in Wyoming and Mississippi. After six weeks of no new contests, Pennsylvania held it's primary. Those six weeks would lead to increased inanity in the media's coverage of the primaries, ranging from Reverend Wright to Tuzla to Obama's bowling score.
County conventions
While there weren't any new contests during those six months, there were a few states that held county conventions, and if you watch the animation closely, you may notice the changes in those states. Nevada held most of its county conventions on February 23, but the Clark County convention had to be delayed until April 12. Iowa's county conventions on March 15 produced the biggest delegate shift of the three shown here, with a net gain of 10 for Obama in the projected count, mostly at the expense of Edwards. Finally, the Texas county conventions were held on March 29, which led to a net delegate win for Obama in Texas.
May and June
The media declared the race to be essentially over at the beginning of May when Obama pulled out a win in North Carolina and a narrow loss in Indiana. West Virginia and Kentucky followed, showing Obama's weakness in Appalachia, while Oregon showed that it was simply an Appalachian problem, not a "hardworking white voter" problem.
Different types of contests
One of the protests put forth by the Clinton campaign was that caucuses were unfair because they tended to have lower turnout, arguing that this was mainly at the expense of Clinton voters, since they favor the activists of the party (who by implication, lean Obama). But, as should be pretty clear by the subsequent maps, this wasn't nearly the factor that the Clinton campaign made it out to be.
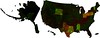
Caucuses
With the exception of Maine, the caucus states are a contiguous bloc west of the Mississippi. While all these caucuses resulted in delegate wins for Obama, this probably more a result of the region favoring Obama over Clinton than Clinton voters being unable to caucus
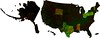
Primaries
Looking at the primaries, on the other hand, it's not hard to see why the Clinton campaign liked them better. They happened to fall in more favorable regions of the nation.
I should note that in these maps, I have excluded Florida and Michigan, though Michigan was an open primary and Florida was a closed primary.
Open Primaries
There is certainly, even within the realm of primaries, a clustering of open and closed primaries.
Closed primaries
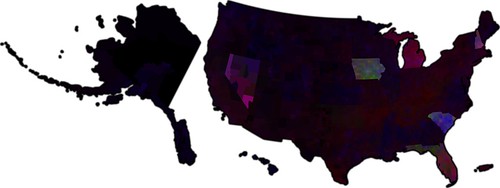
Edwards votes counted toward Obama
Finally, this map is very simply, a transferral of Edwards votes to Obama in the four early states (Iowa, New Hampshire, South Carolina, and Florida) where Edwards was awarded pledged delegates. Note that 3 Floridian delegates and 3 Iowan delegates (the Iowan delegates don't actually exist yet) haven't declared for Obama, which is not reflected in this map. However, most Edwards pledged delegates declared their support for Obama either shortly after Edwards' endorsement of Obama or on June 3 before the polls closed in South Dakota and Montana.
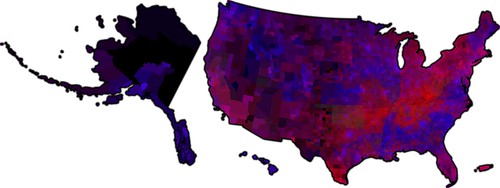
I'm leaving the pure ratio maps out this time, but I'll probably post some later at my blog
Color swaps forthcoming (You can see them here for now.)
Full map:


January:


February 5:


Later February contests:


March-April: