I am fan of Alan Abramowitz, a political science professor who has been analyzing some interesting data pertinent to this election. First, here's a brief bio about him:
Alan I. Abramowitz, Alben W. Barkley Professor of Political Science, B.A. (1969), University of Rochester; M.A., Ph.D. (1976), Stanford University. Previous appointments at William and Mary (1976-82) and SUNY Stony Brook (1982-87). Areas of Specialization: American politics, political parties, elections, and voting behavior. Current research involves party realignment in the U.S. and its consequences for presidential and congressional elections
His curriculum vitae is posted at the link above in a PDF form. He seems to have quite the impressive resume.
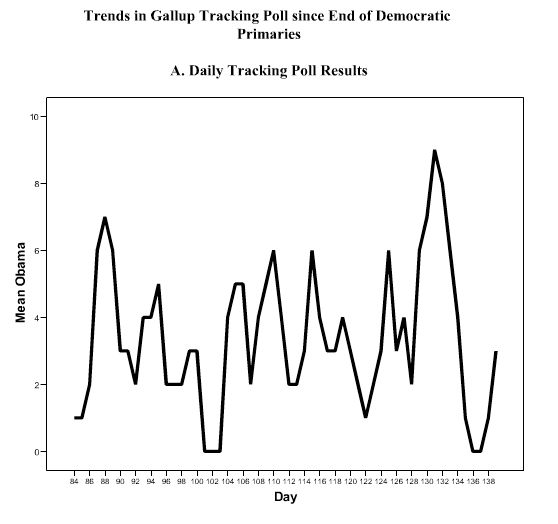
Anyway, here is some of the research he has been doing on this election, which predicts a favorable outcome for Obama. First, let's look at his analysis of the Gallup Daily Tracking poll data, which often seems to get many people in an uproar around here. The first analysis has to do with Obama's peaks and lows in the Gallup Daily Tracking poll data, as evidenced by this graph:
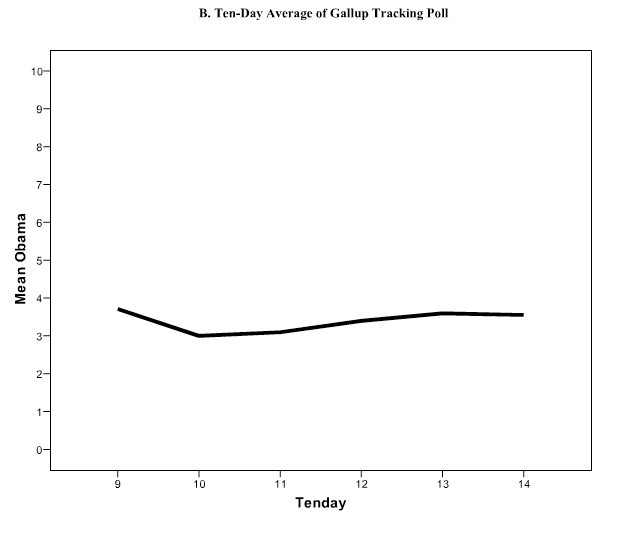
Abramowitz takes that same data above and creates averages over periods of 10 days and plots them in this graph, which shows that Obama has maintained a stable 3-4 point lead over McCain over time:
He concludes:
Explaining the optical illusion, Abramowitz says: "When you group the tracking poll data into ten-day periods it becomes clear that support for the presidential candidates since the end of the primaries has been extremely stable, with Obama maintaining a modest but consistent lead, and that almost all of the day-to-day movement in the data is simply random noise."
Or simply put--stop listening to the talking heads and freaking out on any daily poll.
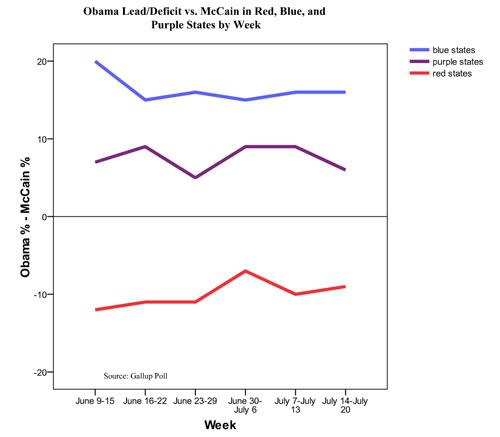
Still worried? Well Abramowitz uses the Gallup Tracking Poll data again to look at variations in the polling data for red, blue, and purple (swing) states. We then get this pretty graph:
He concludes:
The clear impression that one gets from the weekly Gallup tracking poll data is of a highly stable presidential race. Over six weeks of polling, Obama's lead over McCain in the blue states has ranged between 15 and 20 points while McCain's lead over Obama in the red states has ranged between 7 and 11 points. In the crucial purple states, Obama's lead over McCain has ranged from a low of 5 points to a high of 9 points.
Since Barack Obama clinched the Democratic presidential nomination in early June the presidential race appears to have stabilized with Obama holding a modest but significant lead over John McCain in the swing states and in the nation as a whole. Nothing in the Gallup tracking poll data suggests that anything has changed recently.
Caveat: This analysis was done at the end of July before the Democratic Convention and the selection of the VP candidates. I imagine it hasn't changed much since then.
Ok..his next analysis is "The Myth of a Toss Up Election." I love that title. He concludes:
"Too close to call." "Within the margin of error." "A statistical dead heat." If you've been following news coverage of the 2008 presidential election, you're probably familiar with these phrases. Media commentary on the presidential horserace, reflecting the results of a series of new national polls, has strained to make a case for a hotly contested election that is essentially up for grabs.
Signs of Barack Obama's weaknesses allegedly abound. The huge generic Democratic Party advantage is not reflected in the McCain-Obama pairings in national polls. Why, according to the constant refrain, hasn't Obama put this election away? A large number of Clinton supporters in the primaries refuse to commit to Obama. White working class and senior voters tilt decidedly to McCain. Racial resentment limits Obama's support among these two critical voting blocs. Enthusiasm among young voters and African-Americans, two groups strongly attracted to Obama, is waning. McCain is widely seen as better prepared to step up to the responsibilities of commander-in-chief. Blah, blah, blah.
Sound familiar? Well, according to Abramowitz:
While no election outcome is guaranteed and McCain's prospects could improve over the next three and a half months, virtually all of the evidence that we have reviewed - historical patterns, structural features of this election cycle, and national and state polls conducted over the last several months - points to a comfortable Obama/Democratic party victory in November. Trumpeting this race as a toss-up, almost certain to produce another nail-biter finish, distorts the evidence and does a disservice to readers and viewers who rely upon such punditry.
In other words, stop panicking for the chicken littles out there. The signs are good for us, stastically speaking, for Obama to win this election. Trust the experts.
But, but, but...wait! What about all those newly energized Republicans who are swooning over the Sarah Palin VP pick? Won't they swamp the polls in mass on election day? Maybe, but more importantly, Abramowitz also analyzes "The Incredible Shrinking Republican Base:"
Discussions of the current political situation and comparisons between the 2008 election and earlier contests frequently overlook a crucial fact. As a result of changes in American society, today's electorate is very different from the electorate of twenty, thirty, or forty years ago. Three long-term trends have been especially significant in this regard: increasing racial diversity, declining rates of marriage, and changes in religious beliefs. As a result of these trends, today's voters are less likely to be white, less likely to be married, and less likely to consider themselves Christians than voters of just a few decades ago.
The combined impact of these trends on the composition of the electorate has been dramatic. Married white Christians now make up less than half of all voters in the United States and less than one fifth of voters under the age of 30. The declining proportion of married white Christians in the electorate has important political implications because in recent years married white Christians have been among the most loyal supporters of the Republican Party.
So essentially, married, white, Christians in combination is a good predictor of Republican Party affiliation. They make up the core of the Republican base. Here's another pretty graph to show how those groups have declined over time, thereby weakening the Republican brand:

Abramowitz concludes:
The danger posed to the Republican Party by the declining size of its married white Christian base was clearly illustrated by the results of the 2006 midterm election. According to the 2006 national exit poll, married white Christians made up just under half of the midterm electorate and they voted for Republican House candidates over Democratic House candidates by a decisive 62 to 38 percent margin. However, voters who were not married white Christians made up just over half of the electorate and they voted for Democratic House candidates over Republican House candidates by an even more decisive 68 to 32 percent margin. The result was a big win for the Democrats in the midterm election.
The decline in the proportion of married white Christians in the American electorate has been going on for a long time. Moreover, the large generational difference in the prevalence of married white Christians in the contemporary electorate suggests that this trend is likely to continue for the foreseeable future. What cannot be predicted as confidently is how party leaders will respond to this trend. Right now, Democrats appear likely to benefit from a continued decline in the proportion of married white Christians in the electorate because this group has strongly supported Republican candidates in recent elections while voters who are not married white Christians have strongly supported Democratic candidates.
Finally, here is my favorite statistical model for predicting this upcoming election. Abramowitz has come up with a formula called the "Electoral Barometer." I call it non-Rovian math. The formula is the following: EB = NAR + (5*GDP) - 25
So what does this formula mean?
These three factors can be combined to produce an Electoral Barometer score that measures the overall national political climate. The formula for computing this score is simply the president's net approval rating (approval minus disapproval) in the Gallup Poll plus five times the annual growth rate of real GDP minus 25 if the president's party has held the White House for two terms or longer.
In theory, the Electoral Barometer can range from minus (-)100 or lower to +100 or higher with a reading of zero indicating a neutral political climate. In practice, Electoral Barometer readings for the fifteen presidential elections since the end of World War II have ranged from -66 in 1980 to +82 in 1964. A positive Electoral Barometer reading generally predicts victory for the incumbent party while a negative reading generally predicts defeat.
Using this formula, Dr. Abramowitz suggests this is very good news for Obama. According to him,
The Electoral Barometer has predicted the winner of the popular vote in 14 of the 15 presidential elections since World War II. There were five elections in which the Electoral Barometer was negative and the president's party lost the popular vote in all five of these elections: 1952, 1960, 1976, 1980, and 1992. There were ten elections in which the Electoral Barometer was positive, and the president's party won the popular vote in nine of these elections: 1948, 1956, 1964, 1972, 1984, 1988, 1996, 2000, and 2004.
The information required to calculate the final Electoral Barometer score for 2008 will not be available until August when the federal government releases its estimate of real GDP growth during the second quarter of 2008. However, it appears very likely that the Republican Party is dealing with the dreaded "triple whammy" in 2008: an unpopular president, a weak economy, and a second term election. Based on President Bush's net approval rating in the most recent Gallup Poll (-39), the annual growth rate of the economy during the first quarter of 2008 (+0.6 percent), and the fact that the Republican Party has controlled the White House for the past eight years, the current Electoral Barometer reading is a dismal -63.
Using this data, it suggest McCain has some serious hurdles to overcome:
An Electoral Barometer reading of minus (-)63 would predict a decisive defeat for the Republican presidential candidate. The only election since World War II with a score in this range was 1980. In that election Jimmy Carter suffered the worst defeat for an incumbent president since Herbert Hoover in 1932. The second lowest score, minus (-)50, occurred in 1952. That was the last election in which neither the incumbent president, Democrat Harry Truman, nor the incumbent vice-president appeared on the ballot. Nevertheless, the candidate trying to succeed Truman, Democrat Adlai Stevenson, lost in a landslide.
The current national political climate is one of the worst for the party in power since the end of World War II. No candidate running in such an unfavorable political environment - Republican or Democrat - has ever been successful. If John McCain manages to overcome the triple whammy of an unpopular president, a weak economy, and a second term election, it will be an upset of unprecedented magnitude.
Ok, before anyone says it, I understand that we need to still work hard, donate, and GOTV for Obama. Yes, we shouldn't take this election for granted or rest our laurels on the above data analyses. However, the data is compelling, and we should all take some comfort that statistically speaking we should see President-elect Obama by the end of the year. One final note--listen first to the political science experts before the pundits. As it has been said numerous times before, the pundits have a vested interest in making this race look closer than it might actually be.
