I am, like almost everyone here, an avid follower of the daily polls, and a number of the more popular blogs. I am a political addict, and I am especially enthralled by maps that represent electoral college victories. I regularly consult fivethirtyeight (arguably my favorite blog after this one) and electoral-vote.com, not to mention pollster... And so I have, with some fascination, been playing with the new Kos-designed electoral vote calculator. I am impressed!
Witness my tomfoolery below.
I think the obligatory thing to get out of the way is the Worst Case Scenario. While other things could arguably make the map even redder than the one that follows, I think those events themselves are somewhat more improbable than a GOP victory in November (which I already see as a rather remote prospect). Disclaimers aside, put on your imagination hat.
It is October 20th, and in true Evil Bastard fashion, the Bush-Cheney-McCain administration trots out Osama Bin Laden in chains, executing him on live television the day before the election in a GOP convention type atmosphere, with Sarah Palin acting as executioner while John McCain delivers a treatise on Republican victory and the importance of ballot-related patriotism. Here's my nightmare scenario electoral map:
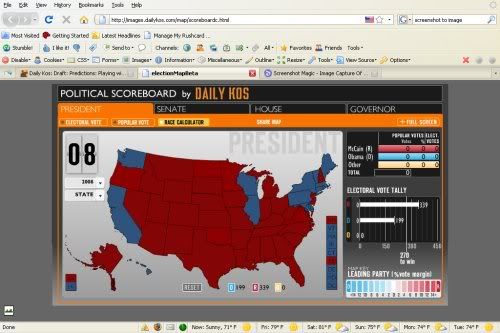
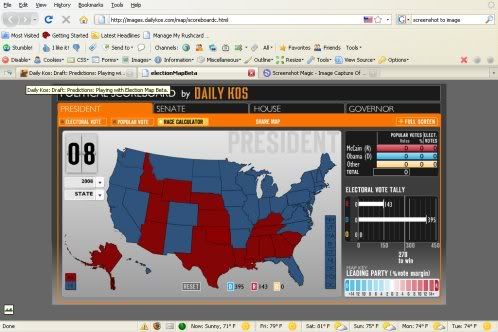
Ew. You see, I think it is highly improbable for Pennsylvania, New Hampshire, New Jersey, and several of the other ugly red states on this map to go red, but given some bizarro-world scenario like the one elucidated above, it might be possible. Now that that's out of the way, here's the best case scenario.
It is October 20th, and Sarah Palin's reputation is in ruins due to a string of lies and scandals repeatedly uncovered by a surprisingly vigilant press. John McCain's staff has abandoned him and he has become increasingly bitter and angry, both on the stump and with the media - several interviewers manage to get his goat and he loses his temper - and in one horrible moment of peaceful calm, he admits to George Stephanoupolous that he would not hesitate in using nuclear weapons against Russia. The American public has seen enough, and a sea of blue rises.
And now, the obligatory final map - the one I think that is most likely on November 4th. I admit to being an optimist, but I think this is a very likely map given the tenor of the campaign right now. I understand such a thing can change very quickly, but it would have to - we have about a month and a half left, and some polls have Obama up in the high single-digits over McCain nationally. Since most of the battleground states only run a point or so better or worse than the national average according to 538, I think it's safe to say that if Obama continues on this course and McCain/Palin continues to stink, we have the map below.
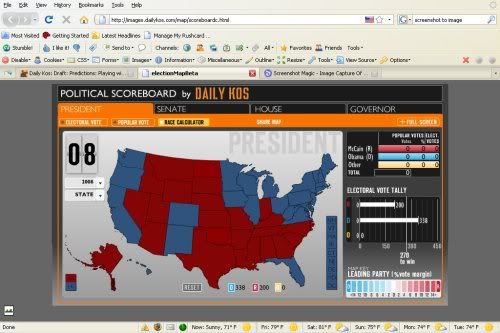
I urge you all to go to the siteand make your own maps of most likely (or any other!) scenarios - and share them in the comments!
