I integrate the week's polls into my election model
Obama is now competitive in West Virginia and North Dakota, while running up large leads in the traditional swing states. Democrats improve their position in the Senate, and Governor races are mixed.
See details and graphs below the jump
*********Cross Posted at StochasticDemocracy**********
We'll start with the National Tracking Polls today:
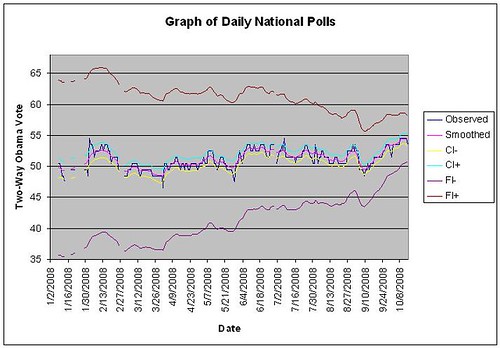
CI- The 95% confidence intervals for what public opinion is today, based on the sampling error in the poll aggregate
FI- The 95% prediction intervals for what the outcome will be in November, based on estimation of variance when treating polls as observations of a random walk(under a hidden Markov Bayesian framework).
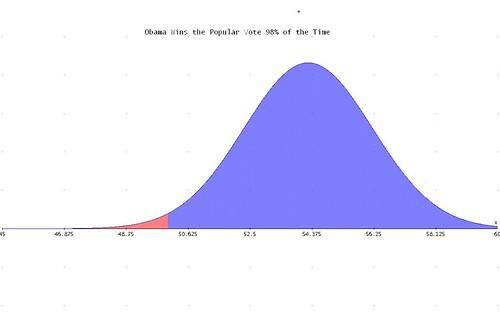
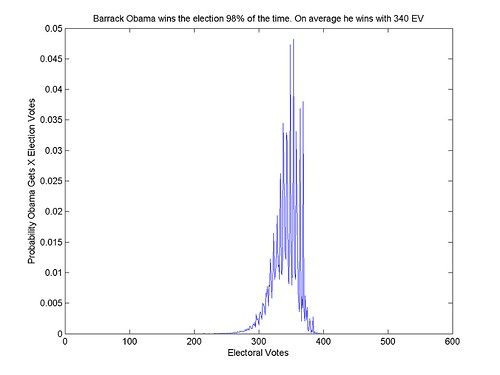
The normal approximation of the histogram of popular vote outcomes on election day
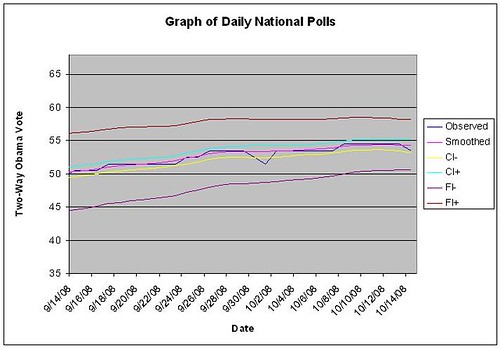
The same graph as the first, but for the last month
Obama is about 9 points ahead on the eve of the last debate, and with only 20 days left in the election. Moreover, the polls are slowly trending in his way. Unless something truly bizarre happens tonight, the national election is effectively over. (For more on methodology of poll aggregation, see the last post)
As far as the electoral college goes, I've incorporated the polls since Friday into the model. Consequentially, the Delta tabs on the applet at the top of the site show the change in the electoral map since then.
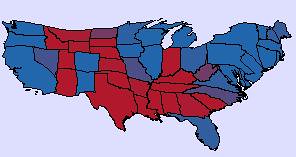
A cartogram, where state's are sized proportionally to their electoral votes. Shaded according to their win probabilities
The new swing states*, in order from most to least Obama friendly, are Missouri(70%) ,North Carolina(65%),West Virginia(46%), and North Dakota(43%). After this, Obama's next best state is Montana (5%). [Other state's probabilities can be seen on the applet]
Since Friday, new polls show Obama has solidified his leads in Missouri and North Carolina. New Polls have shown West Virginia and North Dakota to be competitive, but more polls are needed to draw any conclusions.
And new polling in Georgia suggests that Thursday's McCain +3 poll was an outlier. My model assigns Obama a 4% of victory there.
So onto the Senate:
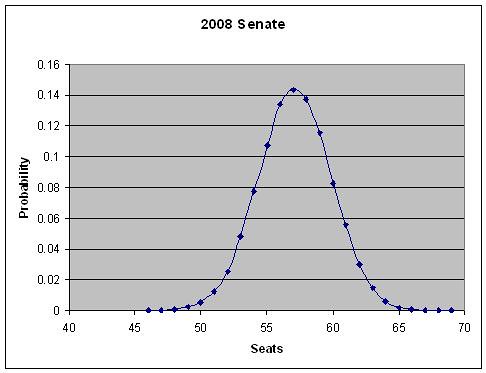
Probability of maintaining control of the Senate(>=50): 99.18%
Probability of improving our position in the Senate(>51): 97.93%
Probability of a Filibuster-Proof Majority(>=60): 19.12%
Probability of a Lieberman-Free Filibuster-Proof Majority(>=61): 10.83%
The competitive seats** are, from most to least Obama Friendly:
North Carolina(78%) - Kay Hagan vs Elizabeth Dole
Oregon (72%) - Merkely(D) vs Smith
Minnesota(71%) - Franken(D) vs Coleman
Alaska (62%) - Begich(D) vs Stevens
Georgia (40%) - Martin(D) vs Chamblis
Kentucky (18%) - Lunsford(D) vs McConnel
Mississippi (14%) - Musgrove(D) vs Wicker
As I've said before, I want to see a senate poll in Texas. Noriega is only at 6% right now in my model, but there has not been much polling there since the Stock Market Collapse. It's possible that the race has tightened like it has in Georgia.
Finally, Governor races:
There are only two remotely competitive races this year, though they are very close:
North Carolina (53%) - Purdue(D) vs McCrory
Washington (48%) - Gregoire(D) vs Rossi
Check back soon for news on the House...
*defined as states where the probability of an Democratic Victory is between 30% and 70%.
**Defined as states where probability of a Democratic Victory is between 10% and 90%
*********Cross Posted at StochasticDemocracy**********
