Stochastic Democracy examines Nate Silver's FiveThirtyEight and how it compares with Stochastic Democracy's own election model.
Also, discussion and interactive web applet of today's new poll's effect on the race, and the effect of Stevens Indictment on Democratic Prospects in the Senate.
http://stochasticdemocracy.blogspot.com/
I've been often asked the difference between StochasticDemocracy's model and Nate's FiveThirtyEight. Since the response "Ours is better" never gets us very far, I've decided to write out the difference in more depth.
The best way to do that, is to simply describe both models. I've done my best to make this as easy to read as possible, but I'm a math major, so I can't make any promises on my presentation abilities. Because of this, I'll do my best to answer any questions in the comments thread.
Out of deference to his hundreds of thousands of visitors, I'll start with his:
FiveThirtyEight
- First, he calculates measures of "pollster reliability"(How wrong pollsters tend to be in proportion to a theoretical ideal pollster) and "house effects"(The extent to which some firms are biased toward one canidate or another) for every pollster. He calculates these measures by looking at data from the 2008 primaries, 2006 midterms, and 2004 presidential elections.
- He then assigns each poll a weight according to to sample size, the age of the poll(he assumes that poll accuracy decays exponentially with time), and reliability behind the pollster. He also changes the margin of the poll according to the historical house affects of the pollster behind the poll
- He now assigns undecided voters in each poll according to a formula he derived from a regression on the 2008 democratic primaries.
- He now runs a "trend adjustment" to "update" outdated polls using a regression. The basic idea is that if favorable polls for Obama are released in North Dakota, then he will "update" the previous polls in South Dakota to be more favorable toward Obama. In practice, he does this in a hideously complicated way, utilizing a LOESS curve fitted on a massive number of dummy variables that are calculated by regression. The regression in this step includes national polls. He explains it better than I could here, here, and here.
- With the newly adjusted polls are now used to estimate(via regression on demographic data) a formula, which is then used to create "538 estimates" that are treated by the model as a poll. He now calculates a weighted average for of every "poll" for every state.
- He then estimates how much public opinion can change between now and the election, by looking at data from the 2004 and 2000 elections(See his original post on the subject here). He has probably changed his methodology since then, but Nate hasn't been very open on this front.
It's important to note that he assumes that states will move together, using a state similarity metric in order to estimate covariance. He also assumes that polls will "tighten" as election day approaches.
- Finally, he simulates 10,000 "elections" using the above model, giving us the summary statistics.
[That is the short version, I've skipped some things...]
Now, I have little quibbles with the individual steps involved(And Stats geeks can see a long rant about them here). But my bigger concern is that his model is too complicated. His model has so many moving parts and implicit assumptions, that it's hard enough to even check it's consistency, let alone accuracy.
StochasticDemocracy
Our model is considerably simpler. At heart, we assume that public opinion follows a random walk. But unfortunately, we don't get to observe public opinion directly, we only observe polls.
But if we want to study public opinion using polls, we can use a Hidden Markov Framework. (See also, Recursive Bayesian Filtering)
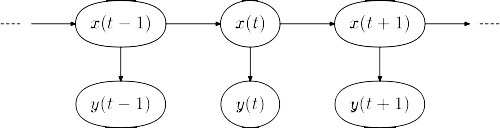
A Sample Hidden Markov Process, where x(t) represents public opinion, and y(t) represent observed polls
Statistics enthusiasts may notice that this resembles Kalman Filtering, which has been used extensively for election forecasting. When day to day changes are Normaly distributed , Recursive Bayesian Estimation is equivalent to Kalman Filtering.
But we have reasons, both analytic and empirical, to believe that the distribution is not normal, but Leptokurtic. In layman terms, this means that "big" events happen more frequently then one would expect using a Normal Distribution. Without accounting for this, "big" events(like the nomination of Sarah Palin or the collapse of the Stock Market) distort our estimates.
So we have implemented a Recursive Bayesian Filter that assumes Leptokurtic disturbances. While I have never seen such a filter applied to political polls, it's been used before in modeling of both financial and economic time series[See Bidarkota and Dupoyet (2005)]. (The filter has been slightly modified to account for little things like the multiple day polling period of polls)
The advantages of this are that under relatively defensible assumptions, this method provides the most efficient and accurate poll aggregation possible given the data available. Better than Pollster's LOESS method, and better than Fivethirtyeight's snapshots.
We use this filter to estimate both the current state of the race, the variance of day to day movement in the state, and the errors involved with our estimates. From there, it is relatively straight-forward algebra to calculate all of the numbers displayed on the site.
My favorite thing about this framework is that it can be expanded heavily while maintaining it's theoretical simplicity. Things like House Effects, Pollster Reliability, and state to state correlations can be easily handled in both simple and transparent ways, with extensions to other types of elections being similarly straightforward. This way, when I make mistakes, it's easy for others to mock them.
So altogether, I recommend that you read us both.
Any Questions?
*********Cross Posted at StochasticDemocracy**********
