Cross-posted from Future Majority.
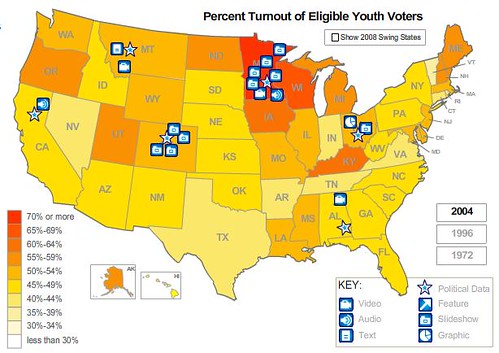
News 21, a project of the Knight Foundation out of UC Berkley has a new website - What's At Stake in 2008, that looks at policy and politics in America in 2008, and the current state of the American Dream. As part of that project, they've produced these incredible state-by-state maps of the US illustrating youth turnout in 3 major elections: 1972, when young voters first received the right to vote; 1996, the nadir of youth turnout; and 2004, the year that the trends we are seeing come to fruition today first started to gain traction.
Interestingly, it's on a map like this that the importance of election day registration becomes clear. While youth turnout was up across the board in 2004, it was strongest, or at least above average, in states that have some form of election day registration: Minnesota, Wisconsin, Maine, New Hampshire, Oregon (vote by mail), etc. Other factors, like competitive races, swing state status, and the size of local field ops also make a huge difference, but EDR can increase turnout by 10 - 12% according to studies by Demos.
Of course, the big question on everyone's mind is, what will this map look like in 7 days?
1972:

1996:

2004: