Stochastic Democracy examines the effects of today's polls on the state of the Presidential, Senate, and Governor's races using it's mathematical model.
Go below the fold or to the website to see discussion, graphs, and an interactive web applet to show the effects of today's polls on Democratic prospects in the Senate, Presidential, and Gubernatorial races.
http://stochasticdemocracy.blogspot.com/
And incase you missed it, read our compare and contrast with FiveThirtyEight here
In case you missed it, see our write-up comparing our method with fivethirtyeight's here.
*********Cross Posted at StochasticDemocracy**********
Summary:
Obama wins 98.5% of the time, with 357 Electoral votes on average. He currently has a lead of 7 points in the national polls.
The Democrats are most likely to capture 59 Senate seats in November. They have a roughly 14% chance of obtaining a filibuster proof majority
Democratic Candidates are very likely to win the only two competitive governor races this year, in Washington and North Carolina.
National Tracking Polls:
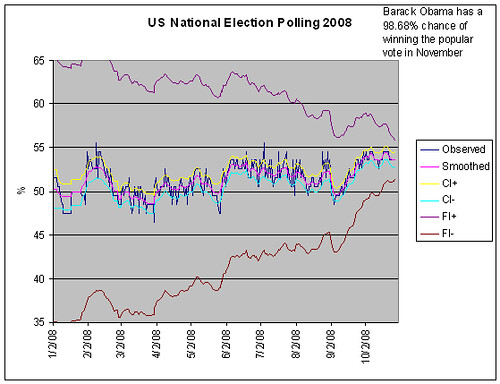
CI- The 95% confidence intervals for what public opinion is today, based on the sampling error in the poll aggregate
FI- The 95% prediction intervals for what the outcome will be in November, based on estimation of variance when treating polls as observations of a random walk(under a hidden Markov Bayesian framework).
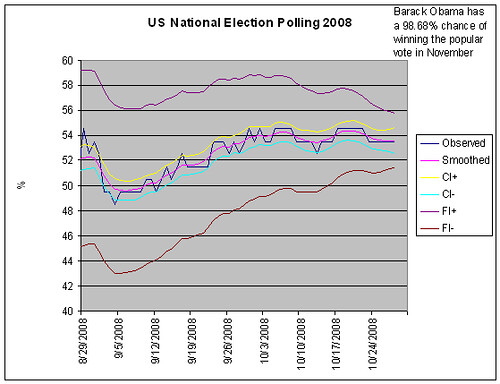
The same graph as the first, but only since the Republican Convention
According to my filter, Obama is currently 6 points ahead.
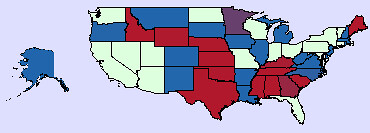
Electoral College
As far as the electoral college goes, I've incorporated the polls since yesterday. Consequentially, the Delta tabs on the applet at the top of the site show the change in the electoral map since then.
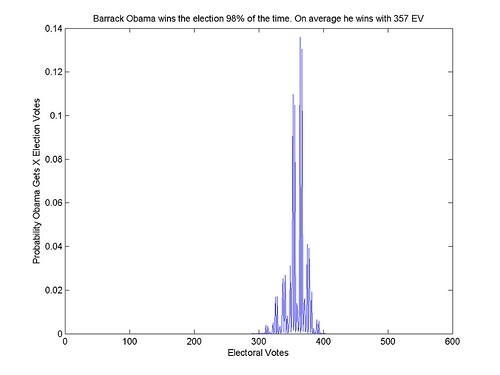
A histogram, showing the distribution of possible presidential election outcomes and their probability
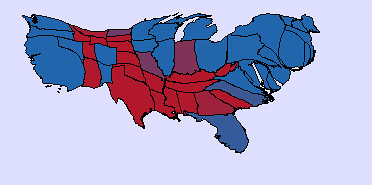
A cartogram, where state's are sized proportionally to their electoral votes. Shaded according to Obama's chance of winning
A map showing changes in polling since Wednesday. Shaded according to changes in Obama's chance of winning
The new swing states*, in order from most to least Obama friendly, are North Dakota(46%), Missouri(42%) and Indiana(34%)
After this, Obama's next best states are Georgia(13%) and Montana(9%) [Other state's probabilities can be seen on the applet]
But what are you doing looking at polls? Go outside, it's Halloween!
Senate:
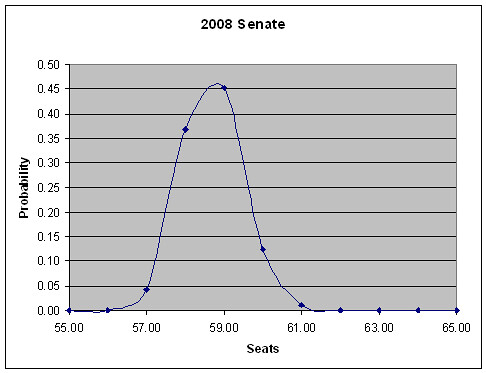
A histogram of Democratic Senate seats and the respective probability of getting that many seats.
Probability of maintaining control of the Senate(>=50): >99.99%
Probability of improving our position in the Senate(>51): >99.99%
Probability of a Filibuster-Proof Majority(>=60): 13.58%
Probability of a Lieberman-Free Filibuster-Proof Majority(>=61): 1.14%
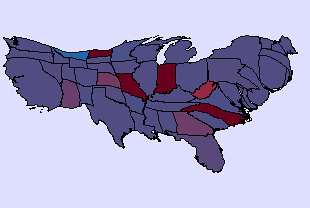
A map of this year's Senate races shaded according to The Democrat's chance of winning
The competitive seats** are, from most to least Obama Friendly:
Minnesota(51%) - Franken(D) vs Coleman
Georgia (18%) - Martin(D) vs Chambliss
The Senate races have simplified a good deal. With Kentucky and Mississpi largely out of reach, the race just comes down to Minnesota and Georgia.
Governor:
There are only two remotely competitive races this year, and Democrats surged ahead today in both of them
Washington (92%) - Gregoire(D) vs Rossi
North Carolina (96%) - Perdue(D) vs McCrory
*defined as states where the probability of an Democratic Victory is between 20% and 80%.
**defined as states where probability of a Democratic Victory is between 10% and 90%
*********Cross Posted at StochasticDemocracy**********
Now that you have your polling fix,
Happy Halloween!
