Crossposted from EP.
Unemployment is a malleable thing. The official unemployment rate released by the BLS (Bureau of Labor Statistics) excludes those individuals who have not looked for work in the last month and those forced to work part time for economic reasons. In short the official rate (U-3) tends to vastly understate the unemployment rate, creating the impression that things are better than they actually are. For many, years the BLS has released what it calls alternative measures of labor underutilization that provide details of the percentage of workers who would like to work (but haven't actively sought it in the last month) and those working part time for economic reasons at the national level.
However, until very recently, the BLS has not released this data at the state level. That has changed. When we look at this broader unemployment rate at the state level, the picture isn't pretty.
This isn't a conspiracy. The problem is small sample size. The BLS uses surveys with a very large number of participants to drive down the marign of error. So the number that we get at the national level is basically the same that you'd get if you called everyone in the US. But, when you go to the states, the number of participants shrink, and when you include a large number of categories, the margin of error goes up. It's still quite low, just not the gold standard that the BLS has set for national unemployment figures.
This is the reason that until the last year, the BLS did not release alternative measures of labor underutilization for the states. And even now that they have, they are releasing 3 month running averages in order to drive down the margin of error. The problem that creates is that it creates the impression that the "real unemployment" rate (U-6) is much lower than it actually is. The map that I created above shows the running average from the last quarter of 2008 and the first of 2009. Which means that it is lower than what it would be if it gave month by month data.
However, as the BLS notes:
Generally, all six measures move together over time, including across business cycles. Similarly, states that have high official unemployment rates tend to have high values for the other five measures; the reverse is true for states with low unemployment rates.
What this means is that we can build on this observation to build a model.
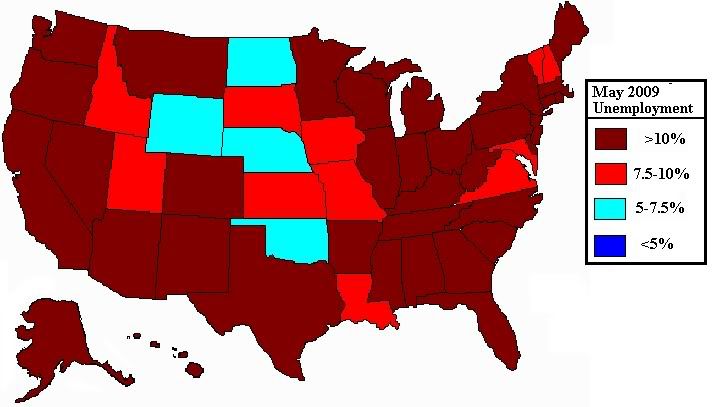
It needs to be stressed that this is only a model, and not something released by the BLS. Because all measures move together over time, we can use the one measure we do have at the state level for May 2009 (U-3, the normal unemployment rate) to estimate the broader "real unemployment" rate at the state level. I did this by dividing the running U-6 "Real" rate by the U-3 "normal" rate. This gives us a proportion. Thus, for example, in Michigan for every 100 person included in the U-3 "normal" rate, there are another 81 that have stopped looking for work, but want it, or working part time for economic reasons. So if we multiply the May 2009 U-3 rate by 1.81 we get an estimate of what the current U-6 rate is.
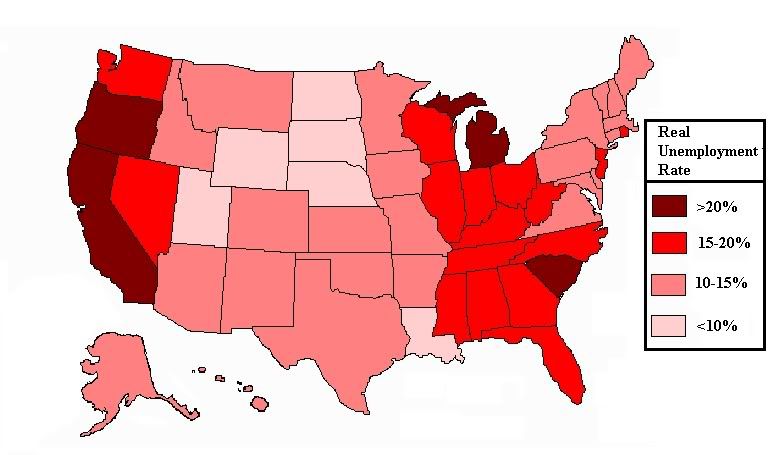
And we get this map (note that the scale has changed from above):
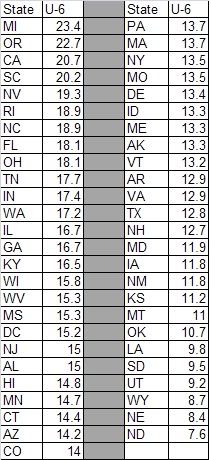
Or to put it in graph form.
What this model suggests is that the "real" unemployment rate in Michigan is around 23.4%, meaning that 1 in 4 people who want to work are without it in Michigan. This is bad, and only going to get worse. As the impact of the auto shutdowns at GM and Chrysler ripples out the auto states (Indiana, Michigan, Ohio) are going to see this grow much higher.
It's not only this the opportunity to look at this broader rate that makes the new state numbers interesting.
Another interesting point relates to the issue of structural unemployment.
One of the components of the U3 measure tells us what percentage of total workers have been out of work for more than 15 weeks. This is an example of structural employment.
Structural unemployment is much harder to deal with than short term unemployment. After all, as bad as being unemployed is, it's one thing to have no job for 4 weeks. It's another if you're out of work for 4 months. In the short term, people can drawn down on savings. With structural unemployment lives are shattered, houses are lost, and all to often lives are taken to escape the feeling of loss that comes with having no hope of finding work and running out of options.
When we look at the percentage of workers included in the U-3 "normal" unemployment rate that have been out of work for more than 15 weeks, the numbers are high nationally, and higher in some states. Since this time last year at the national level, structural unemployment has increased from around 33% to around 45%. I am working with running averages for the Q4 2008 and Q1 2009, so the state numbers I'm going to show are most likely a lot lower than they are now. But there's really no way to tell the current rate.
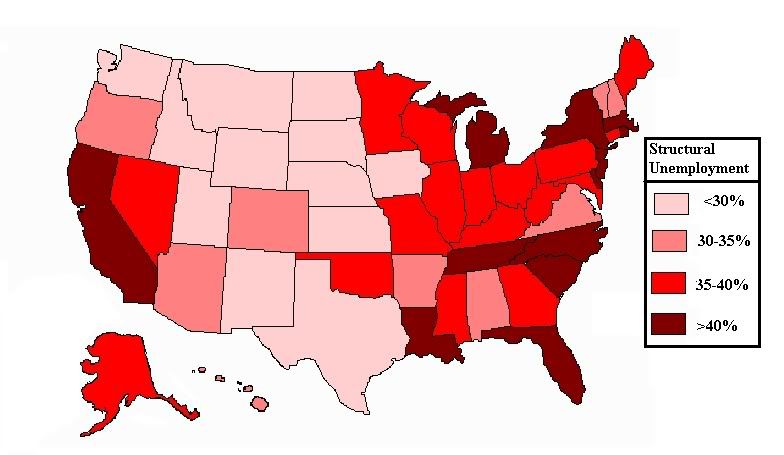
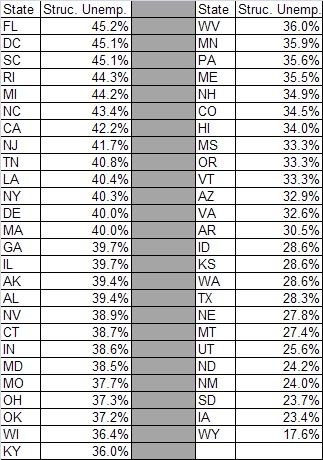
As you can see, in general the higher the U3 rate, the higher than structural unemployment is as a percentage of it.
The consequences of this are dramatic.
A recent report from the Economic Policy Institute (EPI) points out that there are 5 unemployed workers for every current job opening.
Further, this glut of workers willing to take jobs has contributed to wage implosion.
These trends are going to lead to more trouble down the road. Right now workers are spending down on their savings, but the real crisis is going to hit when families with out of work breadwinners have nothing left to support themselves with. There is another wave of mortgage and credit defaults in the making here. And when it hits, it's going to have a far broader impact than those that hit last fall.
