I never thought I would contemplate the end of the housing market decline -- it's been with us for a very long time. But now there are preliminary signs of stabilization. Let's look at the charts.
The existing home sales chart has two important areas. The first lasted from roughly October 2007 - October 2008. Notice that during this time sales were relatively steady. Then came the downturn caused by last falls financial crisis when sales dipped. But now we're again seeing signs of stabilization.
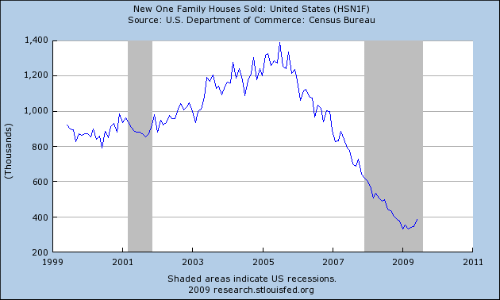
New home sales have been dropping for three years. But notice that sales levels have been consistent since the beginning of this year. In addition, sales ticked up 11% last month.
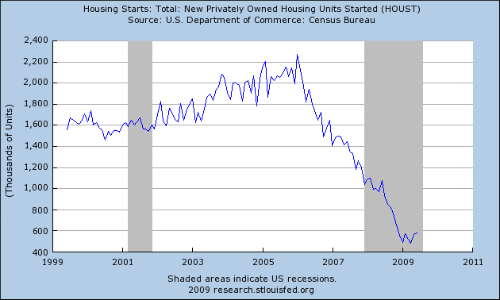
Like new home sales, housing starts experienced a long decline. But, they have been steady since the beginning of the year (albeit at a low level).
Finally, we have the Case Shiller price index:
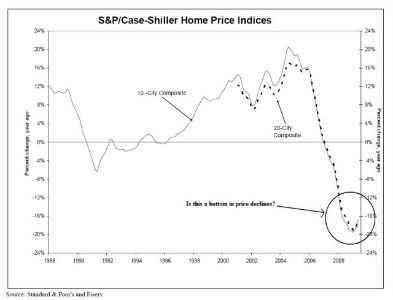
Prices are still declining year over year. However, notice the rate of year over year decline has turned upward -- meaning the rate of year over year decline slowed last month. And the reason is the month to month prices rose last month:
U.S. home prices rose in May on a month-to-month basis for the first time since July 2006, according to the national Case-Shiller home price index released Tuesday.
On a month-to-month basis, prices in 20 selected cities rose 0.5% in May, with increases in 13 cities, compared with a decline of 0.6% in April.
The blog Calculated Risk has proposed the theory that we'll see two bottoms in housing -- one in sales and one in prices. The above charts bear this theory out.
Now, there are still some big issues out there that will prevent the market from going gangbusters for some time. The US consumer is de-leveraging, there is a ton of housing inventory we have to go through (including the shadow inventory on banks' balance sheets) and the banking system is still recovering from a near fatal set of conditions. In other words, stabilization at current levels or slightly higher is the most likely course of events.
This is the first month to month increase we've seen in a long time, so its too early to call it a trend. But when that increase is combined with the steady sales pace we've seen along with the bottoming exhibited in the above charts its looking like a bottom might actually be in.
