This is the next in a quasi-weekly series of diaries on the Northern Hemisphere Arctic sea ice melt season. I write these in memory of Johnny Rook, who passed away earlier this year. He was the author of the blog Climaticide Chronicles.
Lots of news this week, including the July 2009 summary from the National Snow and Ice Data Center. Again, the camera with the NOAA North Pole ice drift buoy is malfunctioning, so I can't put up a decent picture from that location. So I'll go back to the Barrow web cam; Barrow is the northernmost location in the 50 states, at 71.3°N, 156.78°W.

Another item in the news was the update on the expected 2009 Atlantic hurricane season, which was issued on 6 August; good news found here.
The "straight" poop follows after the jump.
Current Conditions in the Arctic
University of Cologne, Germany plot of 6 UTC, 9 August 2009 weather over the higher latitudes of the Northern Hemisphere is shown below. I've labeled the time of day along the Greenwich meridian (through Europe, 6 a.m.), the 90°E meridian (through central Asia, NOON), the international date line (through Bering Sea between Alaska and Siberia, where Vladimir Putin rears his head (and chest and arms, apparently), 6 p.m.) and 90°W meridian through Canada and the continental US (MIDNIGHT).

Temperatures over the Arctic sea ice are near to slightly below 0°C. Note the warmth in northern Europe, with morning temperatures in the upper teens to 20°C. Afternoon temperatures in Siberia seem to be in the teens and 20s°C.
What's the ice extent done this past week? Ice melt slowed down in the last week considerably, as can be seen in the graphic below.
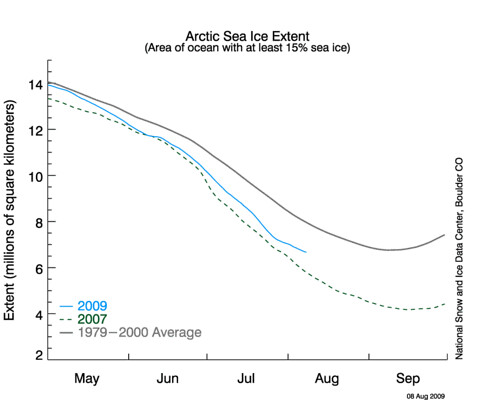
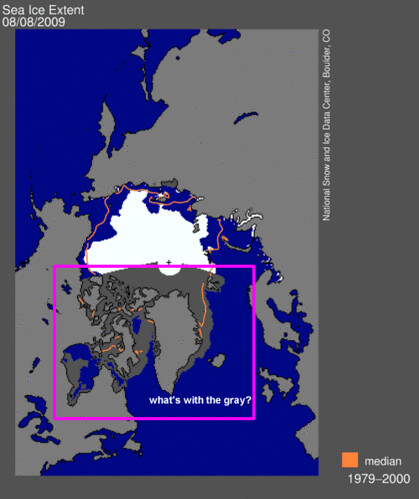
In spite of this, we're now below the mean minimum extent over the 1979-2000 period at about 6.75 million km2, and have about another 5 weeks of melt to go (at least for a typical season). In looking at the NSIDC's areal extent map, it appears there may be a problem either with their graphics creator or (again) with the satellite sensors used to detect sea ice; I'll update the diary later on today if I find out if that's the case, or if there's a glitch with the graphics production. See below.
Alternate source for sea ice concentration graphics
There is another source for sea ice concentration and sea ice extent graphics: University of Illinois Urbana-Champaign's Cryosphere Today website. The graphics for 8 August 2009 sea ice concentration annotated for changes appears below.
 | 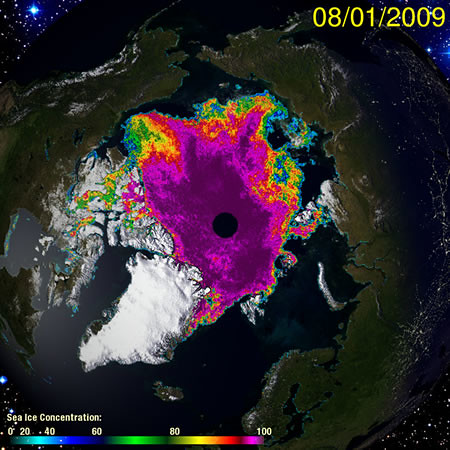 |
For 8 August 2009 on the left compared with 1 August 2009 on the right, note that the areas of decrease enclosed by white are much larger than areas of decrease enclosed by blue. The darkest purple shading indicates the highest concentrations, near 100% or pretty much solid ice. In the UIUC sea ice concentration graphic, a good portion of the ice pack at the fringes is decreasing; anywhere shaded blue is less than 60% covered. The color of the central portion of the ice pack this week seems less uniformly dark purple, with some encroachment of reds and pinks, indicating 80-90% concentrations. My guess is that any significant storms that blow into the Arctic basin from the Pacific or Atlantic would have a significant impact on the Arctic sea ice concentrations, plus would bring in warmer air from the mid-latitudes.
Comparing the 8 August 2009 UIUC concentration graphic to the NSIDC graphic of extent (with 15%=ice covered), we see that the NSIDC white area corresponds well with the UIUC shaded concentration graphic (where 15% is about where the blue shading fades away to a very transparent blue/gray). The NSIDC grey area has much larger extent than the UIUC graphic, and than their previous week's graphic (not shown), which clearly indicates a problem with the graphic. Whether this problem is in the data and thus reflected in the sea ice extent time series (overstating the amount of ice) I do not know. As stated above, I'll update this when I find out something more.
Summary for July 2009 and Comparisons to 2007 and 1979-2000 mean
The summary for July 2009 was released on 4 August. The graphic sea ice extent time series used for the discussion, which includes ±2 standard deviations from the long term mean extent, is shown below (2009 concentration ends at 2 August). July 2009 sea ice extent was at 2 or more standard deviations below the long term normal for the entire month.

The mean July 2009 sea ice extent was third lowest behind 2006 and 2007, as can be seen in this time series from July 1979 to July 2009 below.

Melt this season has been strongest from AK westward to central Siberia, and in the Davis Strait, though wind currents packed the ice against Baffin Island, resulting in a later breakup there than normal, as noted previously. High pressure tended to dominate the Arctic in July 2009; this can result in more sun than usual, although Arctic stratocumulus can get trapped below an inversion created by warmer air getting advected aloft over the near-surface Arctic Ocean airmass chilled by the cold water and ice.

Below is an unusually clear picture from 26 July 2009 of the Arctic ice cap from the Moderate Resolution Imaging Spectroradiometer (MODIS) (top) on the NASA Terra satellite. Dark gray areas over the sea ice correspond to areas of high surface melt. Below that are maps derived from CloudSat satellite data that show total cloud fraction averaged for 20 May to 20 July, in 2007, 2008 and 2009.

The NSIDC report noted the low amount of cloudiness (blue pixels in lower right panel) during the 20 May - 20 July period over the Beaufort Sea north of AK and western Canada. This is a similar pattern to 2007 (compare lower left and lower right panels). This of course doesn't mean we'll see a 2007-like minimum sea ice extent, though ... but things bear watching for increased sea ice loss.
After the sea ice minimum is called, we'll see where things stand, and how the forecasts I diaried about a few weeks ago panned out. Below is a "reprise" of those forecasts in graphical form. Note that now we're appear to be, at 6.75 million km2, at the mean 1979-2000 minimum sea ice extent, but far from these forecast minima, even the highest ones.
Bonus Item: 2009 Atlantic hurricane season update
Thanks to El Niño, the projected number of tropical systems, hurricanes, and major hurricanes expected this hurricane season in the Atlantic has been reduced. See the revised forecast from NOAA here.
A quote from the hurricane forecast bears repeating, regarding El Niño seasons, however:
"El Niño may mean fewer storms compared to recent seasons, but it doesn’t mean you can let your guard down," said Jack Hayes, Ph.D., director of NOAA’s National Weather Service. "History shows that hurricanes can strike during an El Niño." Some examples include Betsy in 1965, Camille in 1969, Bob in 1991, Danny in 1997 and Lili in 2002.
Even though El Niño tends to decrease the number of storms, other climate factors may help to create some storms. As predicted in May, conditions associated with the high-activity era that began in 1995 are in place, and include enhanced rainfall over west Africa and warmer tropical Atlantic Ocean water, which favor storm development.
The calm start to this hurricane season is not a reliable indicator of the overall activity for the entire season. The 1992 Atlantic hurricane season, for example, had a below-normal number of named storms and hurricanes. The first storm did not form until late August, when Hurricane Andrew hit southern Florida as a destructive Category 5 storm. (my emphasis)
