This is the next in an occasional series of diaries on the state of Northern Hemisphere Arctic sea ice, written in memory of Johnny Rook, who passed away in early 2009. He was the author of the Climaticide Chronicles.
Need a break from the health care wars? This is the diary for you. I apologize for not getting this out earlier ... life got in the way. ;-)
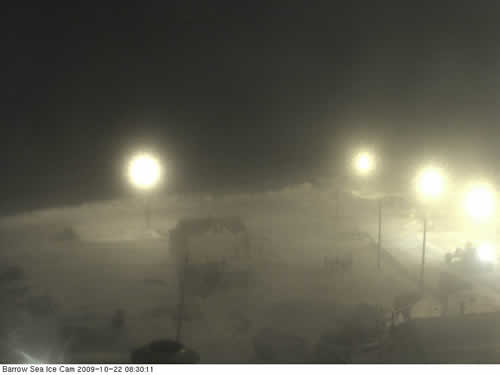
Fall had been been coming on in the Arctic, including AK... but during the first two weeks of October, lo and behold, AK record highs. We'll discuss this more below, but first a look at Barrow on 22 October at 8:30 AM Alaska Time, the last webcam photo available. At this time they're in the middle of a blizzard with blizzard warnings up all along the AK Arctic coast. Temperature in Barrow at 8 AM ADT 22 October 2009: 24°F, wind east-northeast at 30 kt, gusts to 37 kt in snow.
Jump for more.
Arctic Sea Ice in September 2009
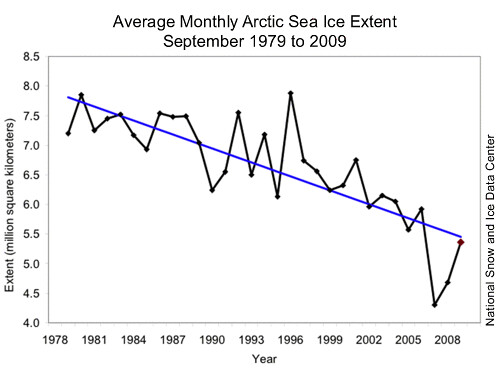
Below is the time series of September mean sea ice extent from 1979 to 2009, in km2. We continue to see some recovery in extent from the dramatic sea ice minimum of 2007, to the extent we're now back to the linear trend line for the 31 year period. That linear trend shows an loss per decade of 11.2% compared to the 1979-2000 average.
Next, let's look at this season's sea ice melt season compared to the 1979-2000 average with a ±2 standard deviation band, and the 2007 record melt season. Those comparisons are found below. The current season time series ends at 5 October 2009.
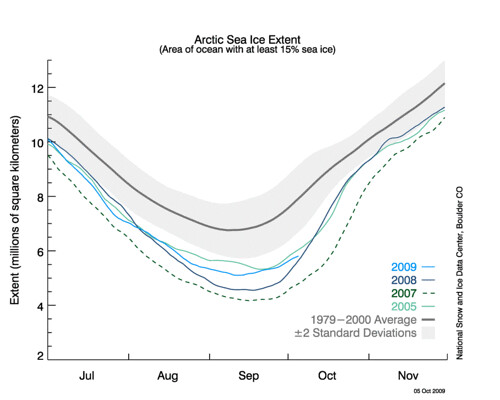
It's clear that this melt season ended earlier than the other three shown; it actually ended at close to the normal time of about September 13. The sea ice extent this year, as refreeze commences, was still third lowest on record at 5 October, and about 4 standard deviations below the 1979-2000 normal (to see this, draw a straight line vertically from the end of the 2009 time series).
What's Been Happening in October?
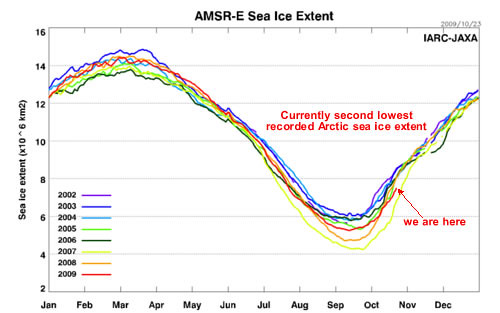
So what's happened during the month of October? Sea ice extent recovery has been moderately fast, but not so fast as previous very low years. As a result, we're now at the second lowest Arctic sea ice extent among years 2002 through 2008, with only 2007 being lower. The third-lowest is 2008. The 2007 sea ice minimum was about 1,200,000 km2 lower than this year's, with 2008 about 800,000 km2 lower.
Aside: I went look to see if anyone reputable had posted anything about the progress of the refreeze season this year and encountered a "Wattsupwiththat" post (In case you don't know, it's Anthony Watts global warming 'skeptic' blog, which I will not link to from here.) that crowed about the brief period in September 2009 when the Arctic sea ice extent this year was a bit larger than that of 2005. It was at a point when 2005 had a melt surge in the latter half of the month.
I don't think you'll hear about the current state of affairs in his blog. He should listen to my warnings about generalizing from small periods of time or small regions of the globe. end snark
A slower refreeze
Why has the current year's refreeze gone slower than at least the prior two years? El Niño doesn't seem to show a strong coincident correlation with Arctic sea ice extent, from what I can tell. In fact, the 1982-83 and 1997-98 very strong El Niño events did not coincide with low Arctic sea ice, though the year following has tended to have less sea ice. So it might be next year that we'll see a resumption of the Arctic sea ice decreases over the summer season, depending on other factors, of course.
What I suspect is causing the somewhat slower recovery in sea ice this year is storminess in the Arctic Ocean. It seems to have been stormier this fall, and thus windier, than the last couple of falls. If this is the case, the sea ice doesn't have an opportunity to set up before wind-driven waves break it up once again.
We also started the refreeze season with some remarkably warm sea surface temperature (SST) anomalies along the Arctic Ocean coast (see earlier diaries). How do the SST anomalies look as of yesterday? See below for the western (top) and eastern (bottom) sectors of the Northern Hemisphere.
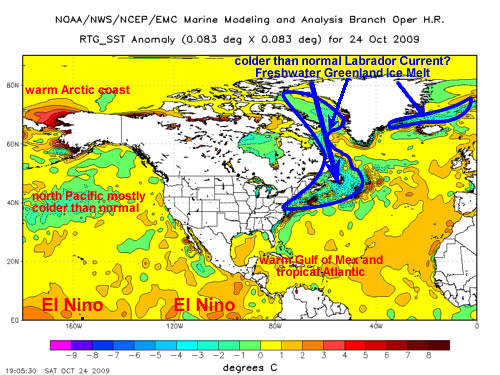
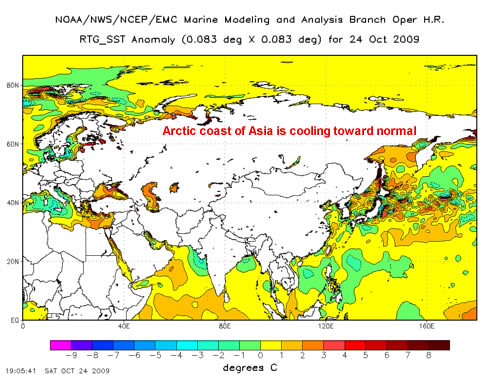
The anomalies have largely declined in the Asian sector, but not so much in the area between Alaska and Siberia in the Bering Sea, where positive SST anomalies are as high as 7°C. Interestingly, this area shows less of an anomaly in sea ice extent than other areas, as you can see below.
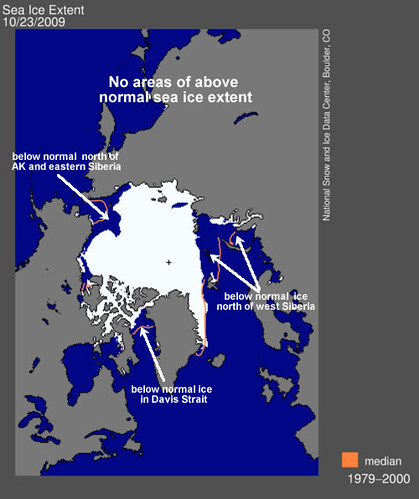
There are no significant areas with above normal coverage. I've labeled the areas with significant negative coverage anomalies.
Other SST Features
One thing of interest around Greenland, and between Greenland and Canada, is the area of below normal SSTs. The Labrador Current (link is to Wikipedia graphic) runs in this area from the east coast of Greenland around the south end of Greenland (Cape Farewell), up the west coast, then around the Canadian Archipelago southward past Labrador to Newfoundland. The current is colder than normal now (and I wonder if it's not less salty as well); a possibility is abnormally high ice sheet melt is getting entrained into the current.
I'd love to see some estimate of the actual salinity and the salinity anomaly of this surface water. Why? Because of the importance of North Atlantic Deep Water Formation in driving the thermohaline circulation. Fresh water is densest at 4°C, salty water at −1.8°C. Cold fresh water will not sink the way cold salty water will. While I've oversimplified things to some extent, this general process drives the global ocean circulation, and has been shown in some coupled atmosphere-ocean climate models to result in a dramatic slowdown in the Gulf Stream and North Atlantic Drift, which warm Europe and the area north of Scandinavia to temperatures higher than they'd otherwise be.
But I digress ... what's to be expected for the next few weeks?
Current Weather in the Arctic: Cold and Getting Colder
As is normal in late October, we're starting to see more −20°C and colder temperatures in Siberia, and in the northern Canadian Archipelago west of Greenland. The graphic below shows the 12 UTC (that's 12 noon Greenwich time) 24 October 2009 weather in the high northern latitudes. I've labeled the solar time for 0° (noon), 90°E (6 pm), 180° (International Dateline), and 90°W (6 am).
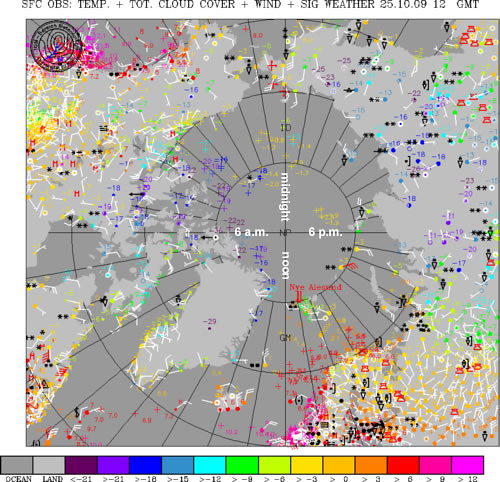
Over the Arctic Ocean basin, it's coldest where ice already exists (the purple temperatures are all less than −20°C (about −4°F)). Sounds pretty cold, yes? Problem is, this is actually close to normal for these areas by late October; to wit, here's a list of October average temperatures, keeping in mind that temperatures toward the end of the month will be lower than these values by about 3-5°C:
| Eureka, Nunavut, Canada | −22°C |
| Alert, Nunavut, Canada | −19.7°C |
| Mould Bay, NW Terr., Canada | −17.7°C |
| Jakutsk, Russia | −15°C (coldest major city in the world) |
In any case, one might expect the refreeze to continue apace, though perhaps with brief interruptions. One important thing to keep in mind long term is the age of the current ice pack. The NSIDC did the work, and came up with the satellite determined age of the ice pack at the 2009 sea ice minimum, compared to 2007, 2008 and the long term (1981-2000) average:
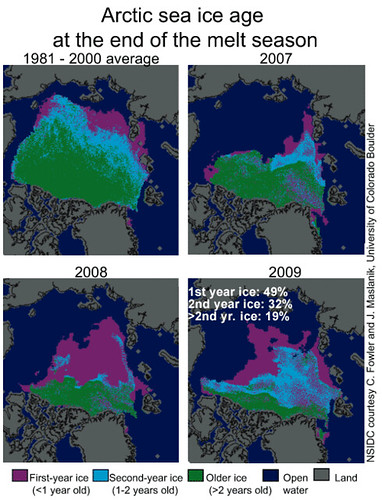
According to the NSIDC:
The ice cover remained thin, leaving the ice cover vulnerable to melt in coming summers. Scientists use satellites to measure ice age, a proxy for ice thickness. This year, younger (less than one year old), thinner ice, which is more vulnerable to melt, accounted for 49 percent of the ice cover at the end of summer. Second-year ice made up 32 percent, compared to 21 percent in 2007 and 9 percent in 2008. Only 19 percent of the ice cover was over 2 years old, the least in the satellite record and far below the 1981-2000 average of 52 percent. Earlier this summer, NASA researcher Ron Kwok and colleagues from the University of Washington in Seattle published satellite data showing that ice thickness declined by 0.68 meters (2.2 feet) between 2004 and 2008. (Emphasis mine.)
The second year ice has recovered because of the relatively cool summer this year in the Arctic, but we still had a record minimum in >2 year ice. That's a hangover from the previous 2 years. It'll be interesting what happens next in the long term; I wouldn't even dare to predict that at this point. Uncertainties include the quiet sun and the effect of increased particulate matter (particularly sulfur-dioxide based aerosols, which have high reflectivity) from developing countries, especially China and India, as they continue to use carbon fuels to power their growth.
More Evidence NOT to Use Record Lows in the US as Proof of NO Global Warming
A final aside regarding using short periods of data from relatively small areas of earth to generalize to what is happening long-term ... which I believe is the reason for reduced acknowledgment of global warming as a problem in this country.
The global warming 'skeptics' have taken heart in the colder than normal summer and early fall in the Continental U.S. Now, my opening stated that Alaska had seen record high temperatures in October. The table below gives locations and October 2009 temperature anomalies to date:
| Location | Temp. Anom. (°F) |
| Fairbanks | +7.7 |
| Barrow | +10.3 |
| Kotzebue | +6.6 |
| Nome | +3.3 |
| McGrath | +8.9 |
| Valdez | +3.2 |
| Bethel | +5.7 |
| Cold Bay | +2.7 |
| King Salmon | +8.0 |
| Kodiak Island | +4.1 |
| Yakutat | +2.6 |
They won't use these to amend their comments. I don't use them to PROVE my point, but to point out the fallacy in theirs. McGrath, by the way, had a day where the minimum and maximum temperatures BOTH broke the old record high. You know what to do with that information, right?
UPDATE: McGrath broke its all-time October high on 10 October with a temperature of 67°F. The minimum temperature of 49°F broke the previous record high minimum for the date, but not the old record high temperature of 55°F.
