A front-page diary today by DarkSyde inexplicably touts this blog by Howard Nemerov, an Austin (MN) gun rights advocate, for employing "science and analysis" instead of rhetoric to arrive at his conclusions.
Interested, I randomly checked out one of Nemerov's recent posts, which happened to be about the relationship between suicide, gun ownership, and the unemployment rate.
What I found, in spite of DarkSyde's claim, was a lot of rhetoric and not much science or analysis.
In his blog, Nemerov purports to test two competing claims: one by the Wall Street Journal that rising unemployment causes more suicides, and one by the Brady Institute that increased gun ownership causes more suicides. "Who's right?" asks Nemerov (apparently unaware that both could be right -- or both could be wrong, for that matter.)
Nemerov first draws unemployment data from the Bureau of Labor Statistics, and suicide data from the CDC.
Nemerov presents us with the following graph:
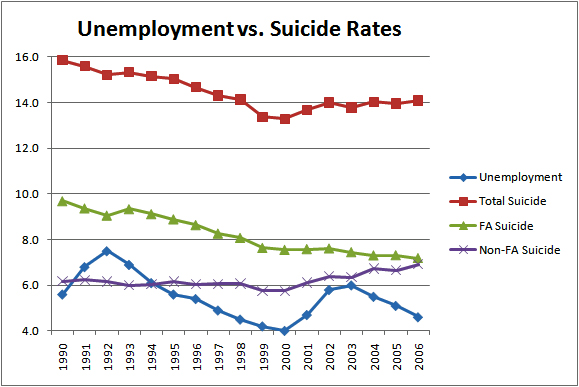
Notice anything odd here? Anything missing? The alleged purpose of Nemerov's entire post was to investigate whether unemployment or gun ownership was the cause of suicide. So where's the gun ownership data here?
Missing, that's where. Nemerov proceeds to do a little hand-waving, pointing to tiny goes-up-here, goes-down-there changes in the suicide and unemployment rates, and decides that the Brady Institute must be wrong, and the WSJ must be right. I mean, come on. He doesn't even try to do a simple correllation, folks. This, apparently, is what passes for "science and analysis" in some circles.
Well, that's just not good enough for me. So I decided to do what Nemerov didn't do: some real science and analysis. Using the same data, or better, that Nemerov used.
Here's the first oddity I noticed: Nemerov confines his analysis to the years 1990-2006, because his desired age range (16 and up) cannot be teased out of the CDC suicide data farther back than 1990. However, if he had changed his age range to 15 and up instead, he would have found that the data goes all the way back to 1981. Odd that one year would make such a difference, but it does, so that's the data I'm going with here.
Gun ownership rates have been part of the non-governmental Generalized Social Survey (GSS) since the early 1970's. Unfortunately, the GSS isn't conducted every year, but we do have every other year recently, and a little more than that in the 1980's. But that's enough to do statistics and draw correllations.
That leads us to this graph:
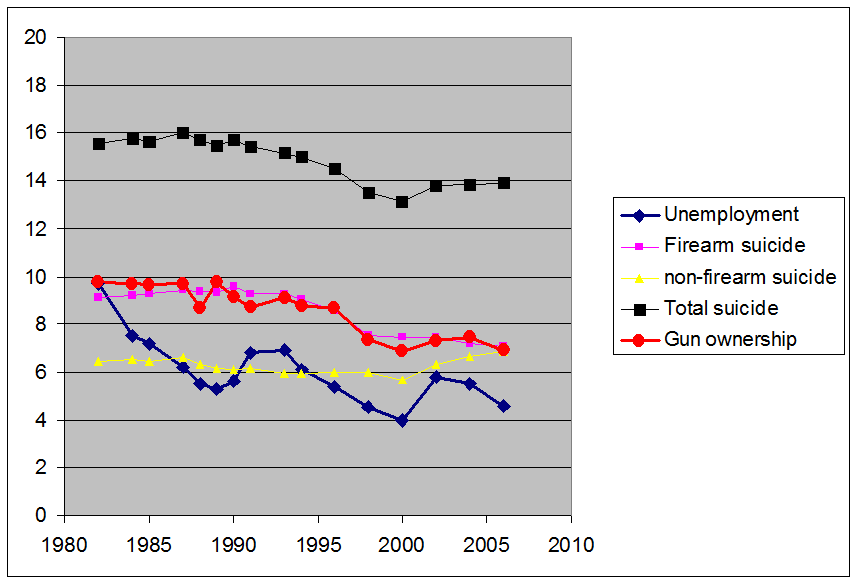
Suicide rates per 100,000. Unemployment rates in per cent. Gun ownership in percent * 0.2, for scalability.
A few of interesting things jump out. First of all, the gun ownership rate and the firearm suicide rate track very, very closely. Second, the unemployment rate and the suicide rate, while both going generally downward during this period, aren't tracking nearly as well. Third, the non-firearm suicide rate stays pretty steady and doesn't track with either unemployment or gun ownership at all.
We can formalize these eyeball guesses by running correlations across these variables, to see what variable is linked with what, and how strongly. When we do that, we find that gun ownership is correlated with the gun suicide rate in a highly statistically significant way (correllation coefficient r = .921, while the rule-of-thumb for significance is r > .7). Meanwhile the correlation between gun suicide and the unemployment rate is only .553, below the edge of statistical significance. Total suicides are correlated with unemployment a little better at .629, but that's still below statistical significance. But the correlation coefficient for total suicides and gun ownership also improves a bit too, to .932, so going with total suicides instead of firearm suicides doesn't buy Nemerov anything.
Having done that, let's try another exercise. Let's run a statistical model to try and use both unemployment and gun ownership to explain suicides. Here, let's use the total suicide rate, because that's a little better for the "unemployment explains it" crowd. Let's start by setting up an equation that might model the suicide rate, like this:
Suicide = (a * ownership) + (b * unemployment)
In other words, we're assuming that both gun ownership and unemployment contribute to the suicide rate, and we're trying to statistically determine how much of each goes into it. If we include all relevant causes when trying to model an effect, our model will improve and explain more of the variance. There's a standard algorithm that can do the stats for us (I use an implementation called Nonlin by Phillip H. Sherrod).
The results are interesting:
| variable | estimate | error | t | prob(t) |
| a | 0.2214 | 0.01500 | 14.78 | 0.0000 |
| b | -0.1498 | 0.1049 | -1.43 | 0.1751 |
The key thing to keep your eye on are the t statistic, and the prob(t) in the right hand columns. T tells us how far away from zero the variable is in relative terms, and prob(t) tells us the likelyhood that the variable really is zero. Here, the variable b, which is the one associated with unemployment, has a 17.5% chance of really being zero. In other words, we cannot statistically eliminate the null hypothesis for unemployment.
We can, however, eliminate the null hypothesis for gun ownership very easily. The prob(t) statistic is flat zero.
In other words, once we control for the effect of gun ownership, unemployment has no statisically significant effect on suicide rates. In fact, the best fit for variable b, the unemployment variable, is negative -- implying that unemployment might actually cause fewer suicides. One cannot make that claim, however, because it's still statistically insignificant regardless of what side of zero it's on.
The combined gun ownership-plus-unemployment model explains 80% of the variance in suicide rates. An alternate model using gun ownership alone explains 79% of the variance in suicide rates. So the difference is trivial, meaning adding unemployment doesn't improve the model much -- and it only improves the model at all because the residual correlation is negative, i.e., if we believe that unemployment causes less suicide.
It turns out that the Brady Institute is right, and the Wall Street Journal is (as usual) wrong.
And that's some science and analysis you can count on.
Geeky update:
It occurred to me after posting this that my simple model above was a bit too simple; I should have included a free variable to allow the model to have non-zero suicides if the gun ownership rate and unemployment were both zero. So instead of the above equation, an improved version looks like this:
Suicide = (a * ownership) + (b * unemployment) + c
... where c is the free variable. When you do things this way, the overall fit of the model improves a bit, now explaining 84% of the suicide rate. The same model without unemployment explains 83% of the suicide rate, again showing that unemployment makes no difference. The variable statistics do change somewhat, although the conclusions are the same. Here's the new variable stats:
| variable | estimate | error | t | prob(t) |
| a | 0.1783 | 0.0246 | 7.26 | 0.0000 |
| b | -0.1106 | 0.0960 | -1.15 | 0.2697 |
| c | 1.639 | 0.7823 | 2.10 | 0.0563 |
The case for unemployment becomes even worse, with variable b now far beyond significance. Free variable c is sort of on the edge of significance, at about 6%. Variable a, for gun ownership, is still highly significant, though not quite as high as earlier.

