NOTE: A couple of days late, but not a dollar short, unless you don't believe the preponderance of evidence.
I'm continuing the Northern Hemisphere Arctic sea ice melt season diary series in memory of Johnny Rook, who passed away earlier this year. He was the author of the blog Climaticide Chronicles.
Let's start off with a picture from the NOAA north pole drift buoy camera from 18 July 2008 at about 0400 UTC. Note that it's cloudy and that much of the snow and ice is intact. Temperatures have been a shade over freezing of late. On June 26, there was no visual evidence of melting, now there is quite a bit more such evidence.
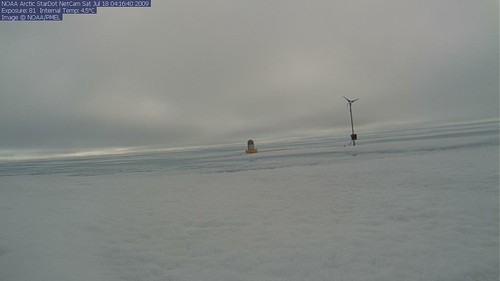
Temperatures from 19 and 20 July can be found here. It's been near freezing. More below.
Current State of Arctic Sea Ice
Data from over the weekend is shown in graphics below. The total areal coverage for Arctic sea ice from April 1 through July 17 2009 is shown here, with comparisons to the 1979-2000 mean areal coverage and the 2007 melt season coverage (2007 was the record minimum areal coverage year). All figures are in square kilometers.
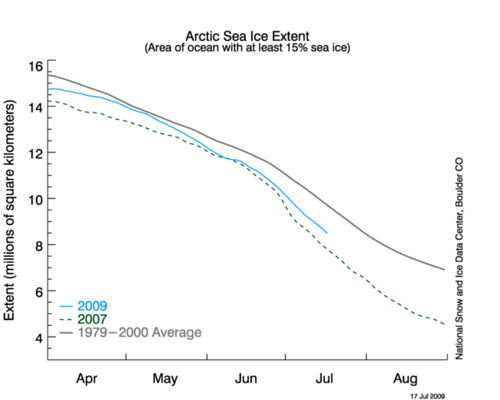
We're currently running a bit more than 2 standard deviations below the 1979-2000 mean (See graphic from last diary for a picture of what ± 2 standard deviations from the 1979-2000 mean sea ice extent looks like, shaded in light gray.).
The current Arctic sea ice concentrations are shown in shading in the north pole projection below from the University of Illinois Urbana-Champaign. Anything from dark blue to light blue indicates concentration of 60% or less.
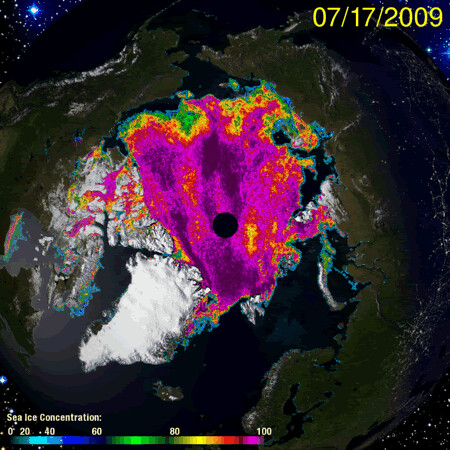
To see the average sea ice extent compared to normal, click on this link for the extent for yesterday compared to normal. In doing so, you'll note below normal sea ice extent over much of the Asian sector of the Arctic Ocean basin, the Davis Strait west of Greenland, and to a lesser extent north of the North American sector. There seems to be a bit more ice than normal in Hudson Bay and along the east coast of Baffin Island.
Current weather conditions
The map or arctic weather conditions from the University of Koeln, Germany from 00 UTC 21 July 2009 (that's 8 pm EDT yesterday) is shown below. Surface data in the Arctic is sparse and comes from drift buoys with weather observing equipment on the ice or ice floes. Where there is data, temperatures are near to just over 0°C (freezing point of fresh water). Winds, in the few places they're indicated, are relatively light (5-10kt).
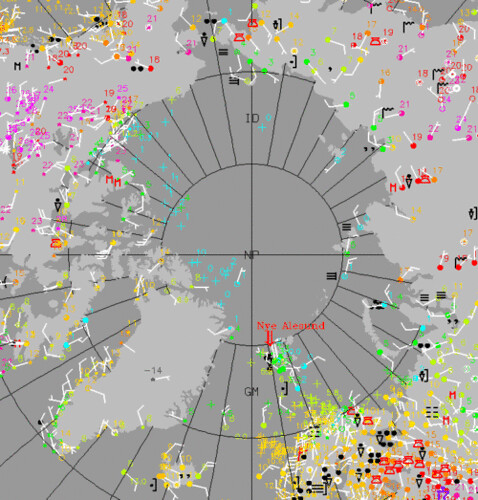
High pressure (not shown) seems to be dominating much of the Alaskan/Siberian side of the Arctic basin. There are no real signs of anomalous warmth from what I can see in the current patterns over the Arctic. This may bode well for retention of more sea ice than last season, but this will be highly sensitive to intraseasonal variability; that is, temperature, solar insolation, and wind anomalies over the next 8 weeks.
Ensemble of Sea Ice Minimum Forecasts
I encountered something new last weekend; a group or "ensemble" of sea ice minimum forecasts that are valid for this September from a group of knowledgeable scientists; this was from the Study for Environmental Arctic Change (SEARCH) web site. This graphic is from the home page for the sea ice forecast, which was based on June 2009 data. Specifics on the forecasts can be found here.
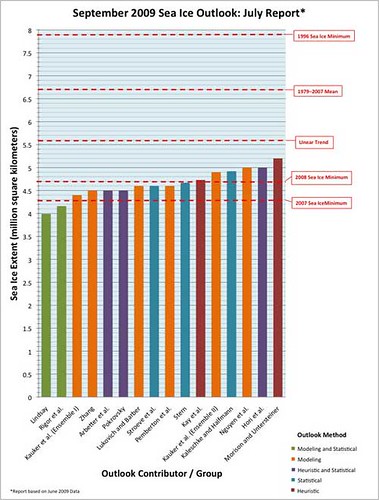
Some of the forecasters run their own ice models forced with expected weather conditions from a low resolution climate model; others base their forecasts on statistics, still others on "heuristics" (i.e. based on their experience), including the current and forecast weather conditions, and/or the current condition of the sea ice. There are a few that combine techniques, modeling/statistical and statistical/heuristic. On the histogram is each group's forecast, the 2007 and 2008 minimum sea ice extent, an extrapolation of current linear trends in sea ice, and the 1979-200*7* mean sea ice extent (which will be lower than what's shown on the sea ice extent time series graphics). Each of these forecasts is color coded by the method used. The contributor or group that did the forecast appears at the base of each bar.
Modeling/statistical forecasts have the two lowest forecasts, in fact breaking the 2007 record minimum. Ten of 16 are below the 2008 minimum, while six of 16 are at or above the 2008 minimum. Modeling only forecasts are spread out the most but tend toward the median forecast value, while statistical only tends a bit higher. This makes sense given statistical methods would be based on a long term time series, which would have historically higher values and likely slower melt rates. Both of the heuristic methods are above the 2008 minimum. We'll revisit this forecast after the actual sea ice minimum is reached in September 2009.
Summary
There's really nothing extraordinary to report compared to recent melt seasons. What happens next will depend on any anomalous winds, temperatures, and/or solar input. The 2007 record minimum was the result of a combination of unusually large amounts of sunshine, southerly winds in the Alaska to Siberia sector, and very much above normal temperatures (See the discussion here; scroll down to the 9 Sept. 2007 entry.). It remains to be seen if we will have a repeat of that this year, or if conditions will be less conducive to sea ice melt.
Stay tuned.
