Independence Day 2009. Another day forward in U.S. inaction on reducing greenhouse emissions. Another day of lies from the energy industry (I'm sure I can find at least one in the news, and many more on TV).
In any event, here's the North Pole web cam from Independence Day 2009 at about 13 UTC:
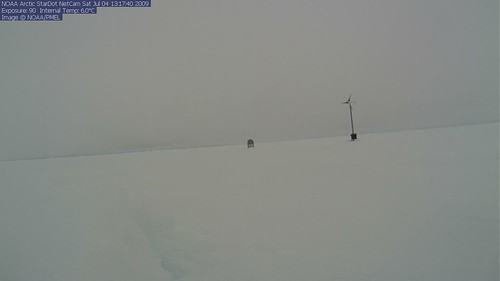
An overcast day at the location of the web cam, which is probably drifting south to the region between Greenland and Novaya Zemlya, an area to which the Arctic Ocean sea ice tends to exit.
For more on the condition of the Arctic at this point in the melt season, see me after the jump.
UPDATE:
Someone asked in the comments about sea ice volume, which to first order relates to the age of the sea ice. Here's a good link for that, and it includes a comparison between the 1981-2000 mean sea ice age in April and that for April 2009. Also, the post has a time series of changes in 1st year, 2nd year, and > 2nd year ice from 1980 to the present.
The 2009 Melt Season to Date
Here's the time series of areal ice extent from its approximate beginning on 1 March 2009 through 4 July 2009 (blue), compared to the record melt season of 2007 (dashed) and the 1979-2000 mean (thick gray).
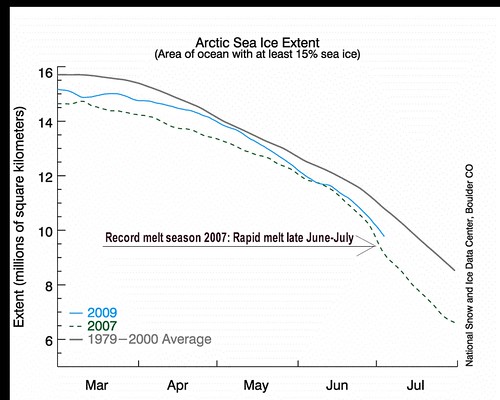
After a marked slowdown in melt when this season hit and briefly crossed the 2007 level, ice loss has been slowly but steadily accelerating (the downward slope of the ice extent has been increasing since mid-June. It's not as steep as 2007, but the 2007 melt season slowed down at about this time that year.
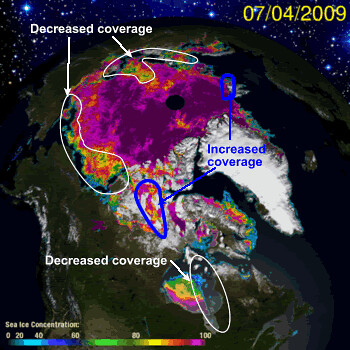
Ice concentrations in the Northern Hemisphere, 4 July 2009 can be seen below. I've annotated the graphic with areas where ice over the past week has increased and decreased (compare to last diary entry on 29 June 2009).
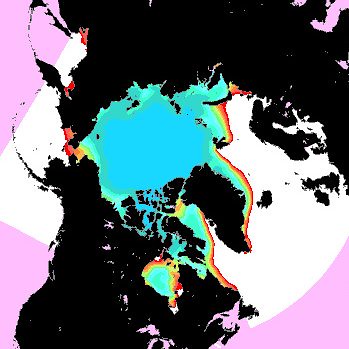
Now for comparison we have the concentration climatology for 1953-1991 from the National Snow and Ice Data Center (1953-1991). Darkest blue is 100% concentration, red is about 20% concentration. Unfortunately the map projection and concentration shading are different.
Biggest negative anomalies from climatology are west of Greenland (Davis Strait) and along the Arctic coast from Asia across to AK and the Canadian Northwest Territories. There are no obvious positive sea ice extent anomalies.
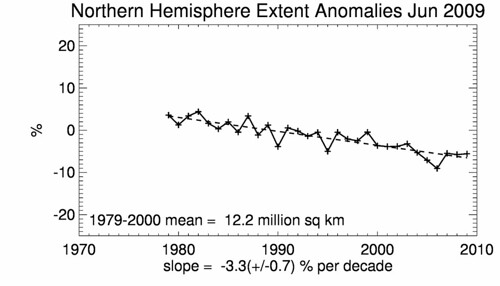
June 2009 compared to previous 30 years
Here is a graphic of June sea ice extent anomalies from every year, 1979-2009. The trend is obvious; we seem to be at a level just about where we were the last two years.
(oops ... this wasn't in the diary! Mea culpa.)
The 2007 melt season saw a record minimum in sea ice extent (surface area coverage), while the 2008 melt season saw a minimum in sea ice volume. I don't see evidence of increases in either in the current data, if anything, this June has probably a slightly smaller volume since there's more "young" ice; certainly no more ice volume than 2008.
What's next?
The NSIDC report for June should be out today or tomorrow. I'll do a quick writeup shortly thereafter.
