Determining who is and who is not a likely voter is a real problem for good pollsters. As such, a variety of metrics have been created to determine the probability an individual will vote. Some of these likely voter screens are based, to a degree, on the level of "excitedness" a polled individual expresses for voting or a candidate. I constructed this model because I wanted to see if I really believe in "likely voter screens", i.e., are they good enough to predict outcomes, based on the polled variables? This is simple minded, but it's a first pass and an interesting exploration of screening techniques.
(join me below the jump)
To begin with, I wanted to see what an "excitability based" screen would do to results, predicting who would actually vote....How close does such a screen come to the final actual vote. So I created a population of voters, some subsamples of which had been polled in the past as to their actual likelihood of voting for a particular candidate. I assigned them an "excitedness metric", and
then looked at the polled estimates of the winner's and loser's final tallies.
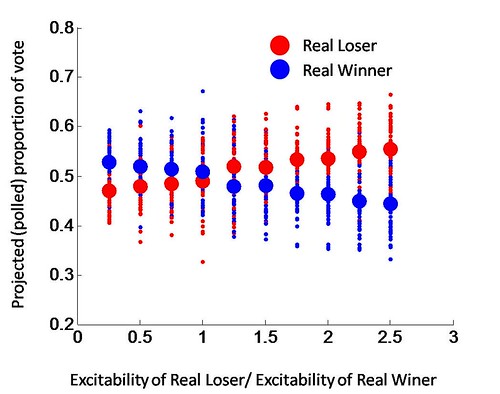
In the plot below, you can see that as the "excitedness" of a particular subpopulation of voters increased relative to another population, the more likely it was that polls would capture that excitedness, and project that candidate to be the winner. Even if, as is the case in this of some iterations of this simulation, the projected loser is the actual winner. The relative proportions of the vote are Actual Winner 0.5025, Actual loser 0.4975.
So, please keep this in mind when looking at polls. The likely voter screen is a real problem, and can distort outcomes as easily as clarify them. More sophisticated voter screens (that incorporate voting history, socioeconomic variables, etc) may lead to more accurate results. But not necessarily. I intend to explore some of those screens in upcoming versions of this model.
This may or may not reflect on today's race at all. Personally, I expect it to be closer than some of these later polls have projected. But I think we could all do with some sober reflection on the nature of polling science, and
MATLAB code for HAMPS (Half-Assed Model of Polling Screens):
%%
%% r is population and voting preference
%%
r=[ones(1,100000) -1*ones(1,0.01*100000+100000)];
for(z=1:10)
mult(z)=2.5*z/10; %% relative intensity or excitedness ratio
x=zeros(1,length(r));
%%
%% excitedness for each subpop
%%
x(find(r==-1))=4+randn(1,length(find(r==-1)))*2;
x(find(r==1))=4*mult(z)+randn(1,length(find(r==1)))*2;;
%%
x=x-min(x);
x=x/max(x);
%%
%% Sample r with x based screen (lots of different polls
%%
for(j=1:50)
i=randperm(length(r));
R=r(i(1:100));
R=R(find(x(i(1:100))>0.3));
allR{j}=R;
end
clear frac_1;
clear frac_2;
for(k=1:length(allR))
frac_1(k)=length(find(allR{k}==1))/length(allR{k});
frac_2(k)=length(find(allR{k}==-1))/length(allR{k});
hold on;
plot(mult(z),frac_1(k),'r.');
plot(mult(z),frac_2(k),'b.')
end
%%
%% mean projected votes to clarify trend
%%
h=plot(mult(z),mean(frac_1),'ro');
set(h,'markersize',12,'markerfacecolor','r');
h=plot(mult(z),mean(frac_2),'bo');
set(h,'markersize',12,'markerfacecolor','b');
end
hold off;
set(gca,'fontsize',15,'xlim',[0 3],'ylim',[0.2 0.8])
