A collection of all the main forecasts for the UK election today, as well as discussion about the merits of each model.
Read more below the fold or at StochasticDemocracy.com
***Cross-Posted at StochasticDemocracy.Com***
Modeling the UK election can be fundamentally divided into two problems: 1) Estimating public opinion from polling, and 2) Determining how public opinion translates into seats in the House of Commons.
Poll Aggregation:
Charles Berry, Electoral Calculus, and most news organisations use a naive "average all the polls" approach.
PoliticsHome and the LSE's Hix-Vivyan model both use a sophisticated recursive Bayesian filter, inspired by Simon Jackman and similar to the model we used with success in 2008. It's primary advantage is that it accurately estimates and accounts for House Effects, pollster introduced error, and sampling error. Under relatively realistic assumptions, such models can be proven to asymptoticly produce the most accurate estimates possible given the data. On the other hand, it's extremely computationally intensive to simulate, requires techniques from graduate level statistics, and can be numerically unstable if not carefully implemented.
FiveThirtyEight averages the two approaches.
Translating votes into seats
Suppose that the Labor party drops by 10% nationally in the polls relative to their performance in the last election. How does that translate into district support?
The natural first approach is to subtract 10% from the 2005 election results in each district. But there are some districts where Labour got less then 10% of the vote. In these districts, our estimates of Labour vote share would be negative! This is called the Unified National Swing (UNS) model.
If Labor's vote share in the polls is 26%, and their share in the 2005 elections was 36%, then this implies that there are 27% less labor votes then there were before. So another approach would be to look at everything proportionally and redistribute 27% of the labor voters to other parties somehow. This ensures that there will never be any negative votes. This is called a proportional swing model.
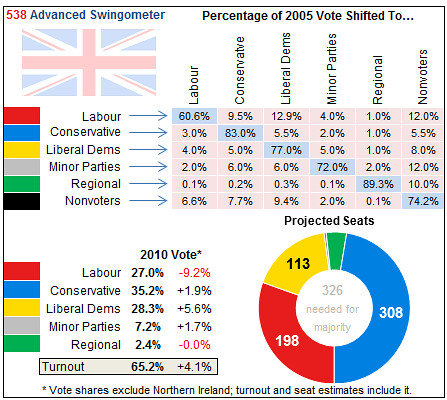
From FiveThirtyEight, an example of a proportional swing model.
On the other hand, suppose we have two districts: One district full of die-hard Labour supports and the other with "swing" voters who happened to vote Labour in the last election. If a scandal causes a drop in the polls for Labour, the swing voters in the second district are far more likely to change parties then the die hard supporters from the first, while the proportional swing model predicts the drop will be equal. Worse, the transition matrix that determines how to distribute voters from one party to another is fundamentally impossible to estimate from polling data, adding an element of arbitrariness to forecasting.
Theoretically, both of the models have problems. Which is right empirically?
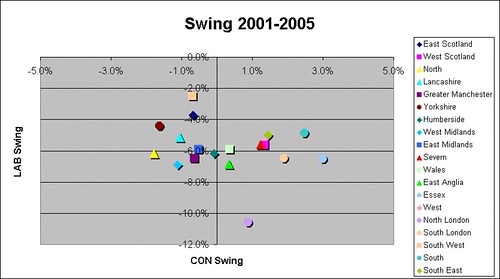
Showing little variation in swing across regions in the 2005 election, consistent with uniform swing
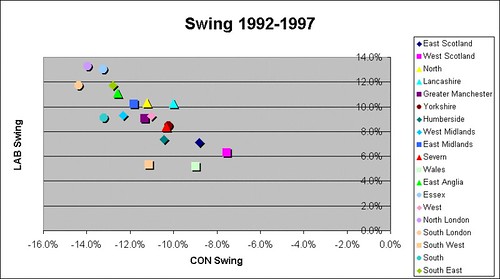
Election results from 1997, showing results more consistent with proportional swing.
Neither of them! Unfortunately, which model is more accurate has changed from cycle to cycle, as the graphs above show. FiveThirtyEight and PoliticsHome are the most prominent respective users of Proportional and Uniform Swing. They've had an interesting debate on the relative merits of their models that can be read in order at here, here, here, and here.
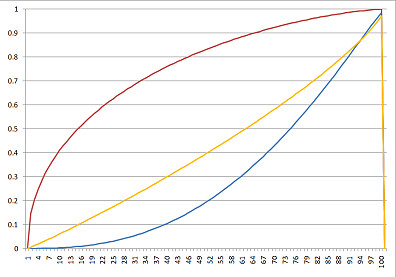
" In all the following charts, the red curve models Labour, blue models Conservative and yellow models the Lib Dems. The horizontal axis is the national vote share for that party, and the vertical axis is the constituency vote share."
A third approach has been proposed by Charles Barry. Because Uniform National Swing and Proportional Swing both work sometimes, why not fit a more general curve that has both as a special case? It's a really interesting insight, but unfortunately, the details of the model with regards to parameter estimation and theory require a bit more work. Still, approaches of this sort are what to watch for in future elections!
So What Will Happen!?
Not a clue! Most models which use Uniform Swing show that Conservatives will fall far short of a majority. Nate's model and Charles' model show more downside potential for Labour. Meanwhile, there are significant house effects in polling. If some of the more Conservative-Affiliated pollster's are right, then the conservatives might be able to squeak a majority.
My personal suspicion is that tactical voting is going to play a bigger role then is commonly assumed, and that this will likely benefit Labour.
But that's only a hunch, so I'll end with some graphs from the Hix-Vivyan model.
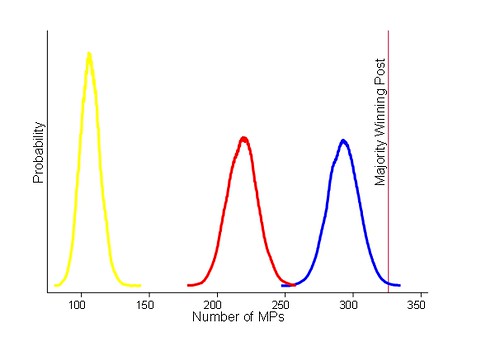
The estimated marginal probability distributions of the number of seats that each party will get.
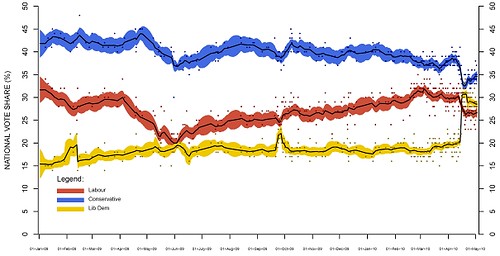
Smoothed vote over time
***Cross-Posted at StochasticDemocracy.Com***
