This is the next in a series of diaries on the state of Arctic sea ice (and other topics as warranted) in memory of Johnny Rook, who passed away in early 2009. He was the author of the Climaticide Chronicles.
I was away in, of all places, Ft. Lauderdale FL this past weekend, so I didn't do a diary right away. I was at a yearly conference for the National Asssociation of Black and White Men Together Annual Convention for 2010. This group at one time had as many as 1200 or so members and 30-some-odd chapters in the U.S. and elsewhere (when known as the INTERnational Association of Black and White Men Together). Now we only have about 10 chapters and maybe one-hundred members. What happened is the topic of another diary I may do some day.
Headlines from last week:
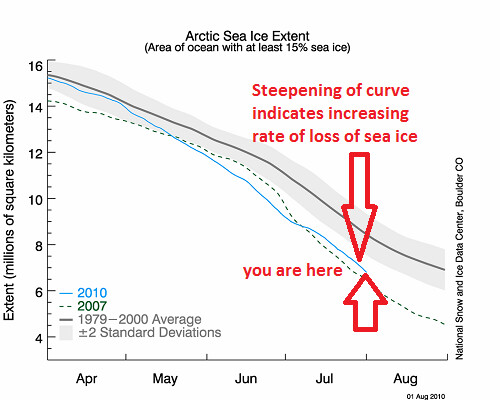
- Rate of ice loss increases
- Strong low pressure anomaly forms over west Siberia
- Anomalous southerly flow from the Asian continent over central and east Siberia
- Off-Arctic: Record heat wave and drought in European Russia, Ukraine, adjacent countries; Moscow hits 101°F; first time ever over 100°F.
Follow me below the fold.
Conditions from 23 July to 30 July
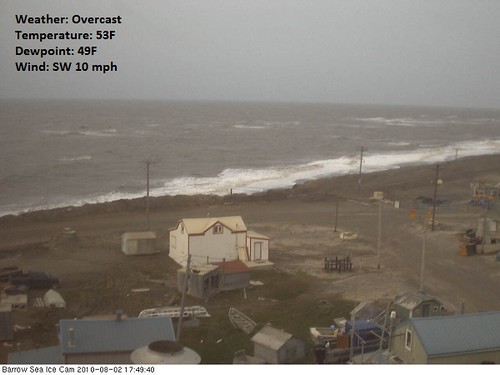
First of course, the obligatory picture from USA's northernmost point, Barrow AK. It was a mild, cloudy day on the Arctic coast of Alaska, as you can see from the annotated weather conditions.
Barrow AK Arctic Sea Ice Webcam, 2 August 2010 at 17:20 Alaska Time
Weekly Climate Anomalies
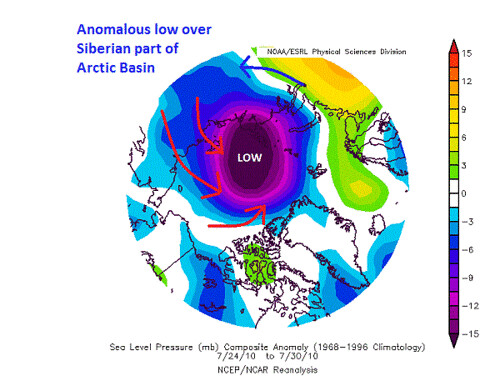
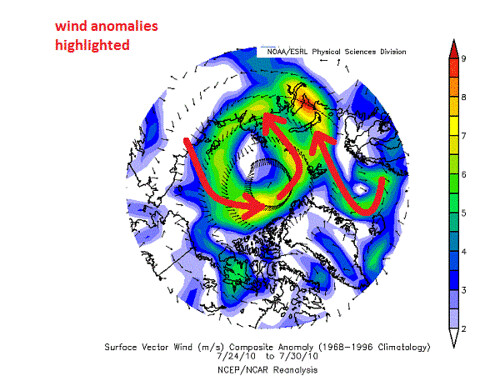
The atmosphere was behaving pretty anomalously during the last week of July 2010. Sea level pressure anomalies can be seen in the graphic below. Note the deep low pressure over northwestern Siberia. I've drawn in the wind anomalies that would be associated with this pattern, but below that graphic is another with are the actual wind anomalies, which I've annotated. There is anomalous southerly flow from the (unusually warm) Asian continent into the Asian side of the Arctic basin.
Mean Sea Level Pressure Anomalies: July 24-30, 2010
Analyzed 10-m Wind Anomalies: July 24-30, 2010
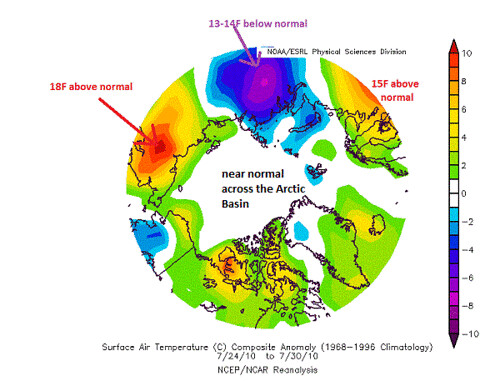
What did that mean for temperature? It was warmer than normal by as much as 18°F (10°C) in northeastern Siberia. East of the strong low pressure area, it was colder than normal by as much as 13-14°F (7-8°C), in an area of north winds.
Surface Air Temperature Anomalies: July 24-30, 2010
Current Condition of Arctic Sea Ice
The time series of Arctic sea ice extent from 1 April through 1 August of this year, and from 1 April through 31 August for the record minimum 2007 year and the mean and 95% probability band for 1979-2000. Note that after slowing down, the Arctic sea ice extent decline has once again accelerated, and is once again approaching levels seen in 2007.
Arctic Sea Ice Extent Time Series: 1 August 2010
(with comparison to 2007 and 1979-2000 mean and 95% probability band, 1 April to 31 August)
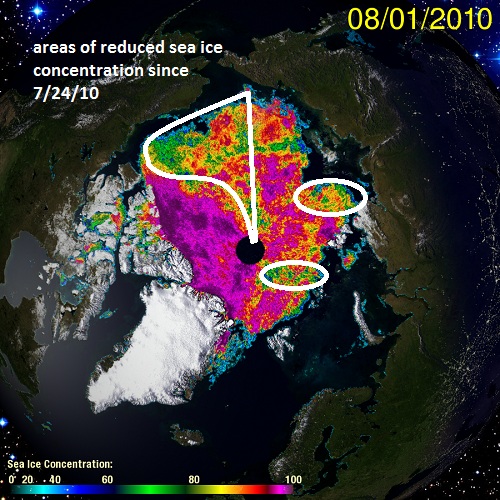
Sea ice concentrations have declined over much of the Arctic basin. The graphic below shows the Cryosphere Today graphic annotated with areas of largest decrease over the period from 23 July to 1 August 2010. Areas with blue or light blue shading, some of which is up near the North Pole, have 60% coverage or less. The ice is looking pretty fragile and broken up; this may be the result of the major wind circulation change at the end of June which placed unusual stress on the sea ice, causing it to break up more. It also means what ice is there is likely more susceptible to abnormal temperatures and winds than was typical in the past (say before 2000).
Cryosphere Today: Arctic Sea Ice concentrations, 1 August 2010
What's Next For Arctic Sea Ice?
The melt season ends in September; the mean melt rate typically slows down as the solar angle decreases with the approach of the polar night on the autumnal equinox in late September. Sea ice minimum is usually in mid-September, though it has a range of uncertainty of a week or two either side of this time.
As usual, where the minimum will wind up depends on the circulation patterns that set up and are maintained during the next few weeks. If the current circulation anomalies remain for an extended period, we should expect:
- Sea ice to be pushed from the Siberian coast toward the North Pole and the more permanent sea ice on the North American side of the Arctic basin.
- Abnormally warm temperatures in central and eastern Siberia
- Abnormally large loss of sea ice from north of Alaska eastward through much of the area north of Siberia
Since my last diary entry, a new sea ice forecast has been issued by SEARCH, the Study of Environmental Arctic Change. The 17 forecasters have dropped their forecasts to some degree to reflect the rapid June 2010 ice loss and the persistence during the month of a "dipole" flow regime that resulted in "... clear skies, warm air temperatures, and winds that push ice away from coastal areas and encourages melt." The regime change in early July prompted a few forecasters to revise their June 2010 forecasts upward because of "the slowdown of ice loss during the first two weeks of July and a change in atmospheric conditions to cooler, cloudier weather."
The current range of forecasts, except for one extremely low outlier, is for from 3.96 to 5.7 million km2 of ice at sea ice minimum. The median forecast is at 4.8 million km2. Forecasts dependent on models alone have a higher sea ice minimum extent than the group as a whole. I'll quote the rest from the report itself:
(The forecasts have a) mean of 4.8 +/- 0.62 million square kilometers. This is below the 2009 minimum of 5.4 million square kilometers and just slightly above the 2008 minimum of 4.7 million square kilometers. Only three of the Outlook contributions give a value equal to or above the long-term linear trend line (5.6 and 5.7 million square kilometers, respectively). All of the estimates remain significantly below the 1979-2007 average of 6.7 million square kilometers, and six estimates indicate a new record minimum.
The spread of Outlook contributions suggests about a 29% chance of reaching a new September sea ice minimum in 2010 and only an 18% chance of an extent greater than the 2009 minimum (or a return to the long-term trend for summer sea ice loss). 53% of the Outlook contributions suggest the September minimum will remain below 5 million square kilometers, representing a continued trend of declining sea ice extent.
Other Climate News
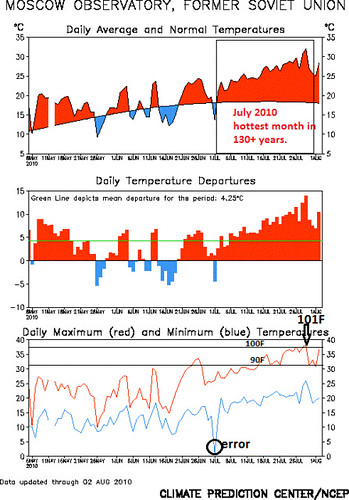
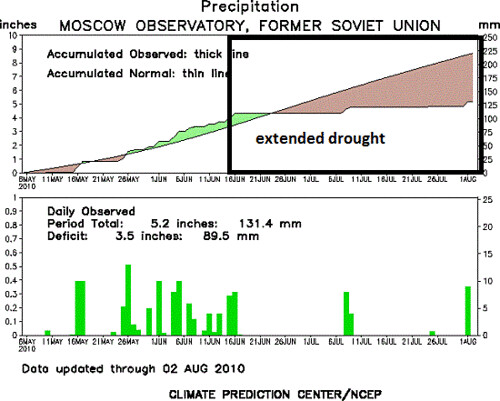
A diary elsewhere today covers the big news elsewhere: Russia has been very hot, very dry, and is now very smoky (Russia Is Burning). Some representative graphics from the Russian capitol appear below for the 90 days ending 2 August 2010. The top panel shows temperature data in degrees Celsius (with a little help in the bottom subpanel for those metrically challenged). The bottom panel shows precipitation for the same period. Precipitation in Moscow RU stopped for all intents and purposes in mid-June.
Moscow, RU 90 day temperature time series ending 2 August 2010 (Celsius)
1st panel: Mean temperature and climatological mean temperatures for date
2nd panel: Temperature anomalies for the last 90 days
3rd panel: High and low temperatures for the last 90 days (missing data are breaks in the red and blue lines)
Moscow, RU 90 day precipitation time series ending 2 August 2010 (millimeters)
1st panel: Accumulated actual and climatological mean precipitation from 5 May 2010
2nd panel: Daily preciptation amounts for the last 90 days
Moscow had its warmest month EVER (in 130+ years) in July 2010. The old record was broken by 4°F, and the warm anomaly was a whopping 12.5°F. For a full month, that is unusual in summer, even in a continental location like Moscow. I just looked at the weather so far this month and they've already set a record high for the month of August at 99°F. Forecasts are for 100°F or more from tomorrow through at least the weekend. Tomorrow's forecast high temperature according to WeatherUnderground will be 104°F, which would break the all time high set on July 29 of 101°F. Unreal.
