This is the next in a series of diaries on the state of Arctic sea ice (and other topics as warranted) in memory of Johnny Rook, who passed away in early 2009. He was the author of the Climaticide Chronicles.
The National Snow and Ice Data Center (NSIDC) has issued its report on [http://nsidc.org/ August 2010 arctic sea ice condition. If you've been following my diaries, you can probably guess at its gist. Headlines from the report:
- August 2010 had the second-lowest Arctic sea ice extent since satellite records began in 1979.
- Sea level pressure anomalies resembled the pattern that results in quickly vanishing Arctic sea ice; low pressure over Siberia and high pressure over the Arctic western hemisphere.
- Arctic sea ice volume at 31 August was about 9,400 km3 below normal.
- Much of the sea ice remaining is slushy and easily moved and melted.
More below.
August 2010 Arctic Sea Ice in Historical Perspective
The mean Arctic sea ice extent in August 2010 was the second lowest in the satellite record starting in 1979 at 5.98 million km2. The time series of August mean areal sea ice extent from 1979 through last month is shown in the graphic below.
Time Series of Mean August Arctic Sea Ice Extent Since 1979
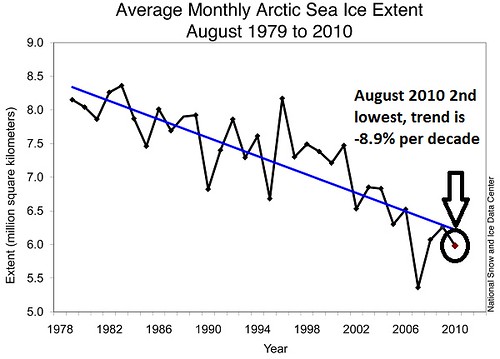
The areal extent trend is −8.9% per decade. Summer values generally have been more affected by arctic warming than winter values, since the stability of the ice has been compromised, and winter refreeze to this point has not been as adversely affected. No matter how thin the ice, it still counts as covering a certain area. That being said, the total area covered by ice (as opposed to covered by at least 15% of ice; the definition of "sea ice extent") has been near record low levels (as of yesterday, 3.079 million km2).
This is why we also need to examine the Arctic sea ice volume. The mean sea ice volume has been at very low levels, as can be seen below.
Time Series of Arctic Sea Ice Volume from 1979 through 31 Aug 2010
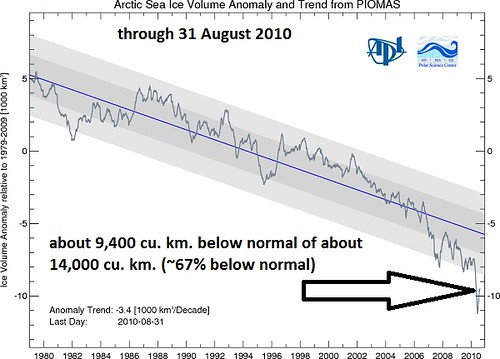
The value in the graphic is the departure from normal. The average 31 August value over the course of the sea ice volume analysis is about 14,000 km3, so the 31 August 2010 actual was about 4,600 km3, or about 67% below normal.
August 2010 Weather Conditions
As I've discussed in my weekly diaries, an atmospheric flow regime that has become common in recent years was prevalent in August 2010. It's known as the Arctic dipole, with sea level pressure anomalies of opposite sign over the Asian Arctic/Siberia and the Arctic Ocean near North America and Greenland. The monthly mean August 2010 sea level pressure anomalies are shown in the graphic below.
August 2010 Mean Sea Level Pressure Anomalies, Polar Northern Hemisphere
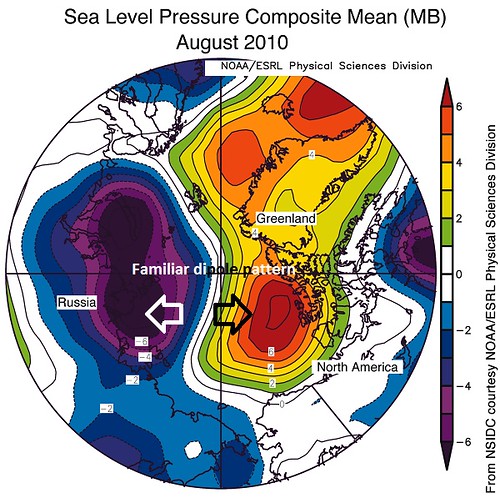
Winds with negative anomalies over Asia and positive anomalies over North America/Greenland are southerly into the central Arctic basin. This does two things:
- Import warm air from the Pacific into the Arctic
- Push ice away from the land surface into the central Arctic
Both factors result in loss of areal sea ice extent.
Current Arctic Sea Ice Extent in Context
The graphic below shows the 1 June to 31 October Arctic areal sea ice extent for the 1979-2000 long term mean and 95% confidence intervals (2 standard deviations above and below the mean), and for individual years 2005 and 2007-2010 (2010 through 6 September only). At this point, the sea ice extent had declined to about 5 million km2.
Time Series of Arctic Sea Ice Extent, NSIDC
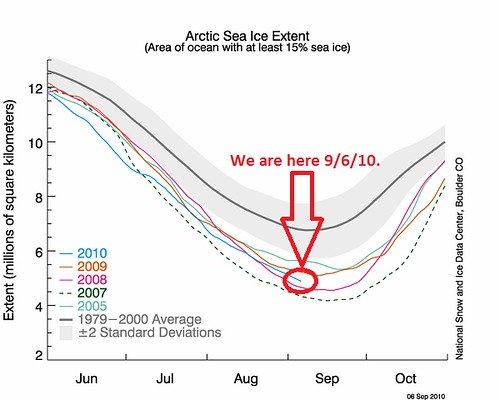
In the last couple days, sea ice extent has fallen further to below 5 million km2, marking the third year (the others were 2007 and 2008) with a sea ice minimum below that level.
The graphic below shows a visible satellite picture of the sea ice over the Arctic during the month of August, centered on the North Pole. Focus on the area inside the yellow rectangle poleward of Alaska.
Visible Satellite Picture Composite of the Arctic, August 2010
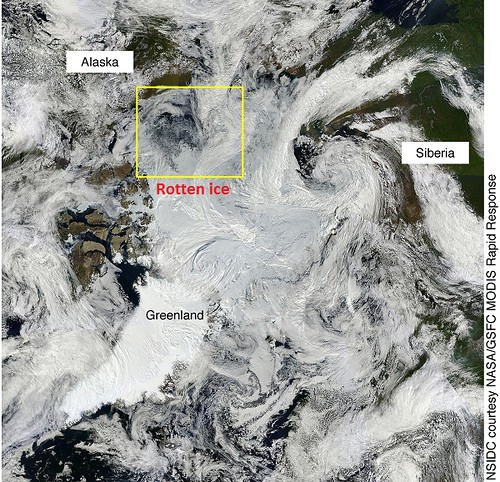
The mottled appearance of the ice in the rectangle is what is called "rotten ice", essentially honeycombed ice that will melt easily and quickly if given the opportunity. This was the kind of ice encountered last September in the Beaufort Sea north of Alaska, by University of Manitoba (Canada) researcher Dave Barbour, and seems to be once again prevalent in the same region.
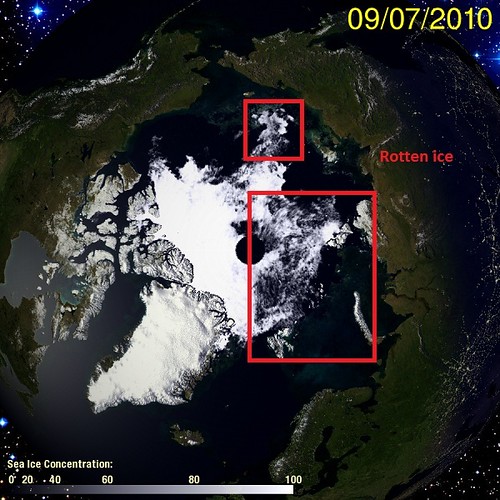
If we look at the University of Illinois Urbana-Champagne Cryosphere Today depiction of Arctic sea ice concentrations in shades of white, much of the area on the Asian side of the North Pole seems to be dominated by rotten ice.
Cryosphere Today Arctic Sea Ice Concentration, Low Color Version, 7 September 2010
Arctic Sea Ice Extent and Ice Area Minima
The next week or two should produce minima in both of these quantities. It's clear no record minimum of the area covered by at least 15% sea ice will occur. However, we do have a chance at a record minimum sea ice area (the area the ice alone covers). You'll hear about it right here when it happens.
