Here in Colorado we have a constitutional limitation on raising taxes known as TABOR. Our community here has been discussing what to do about the fix we're in because of it. I've found that some of my friends have a problem with the need to raise taxes.The argument for this is that taxes are bad for the economy. Keeping taxes low is more important than income inequality as shown by the following two graphs:
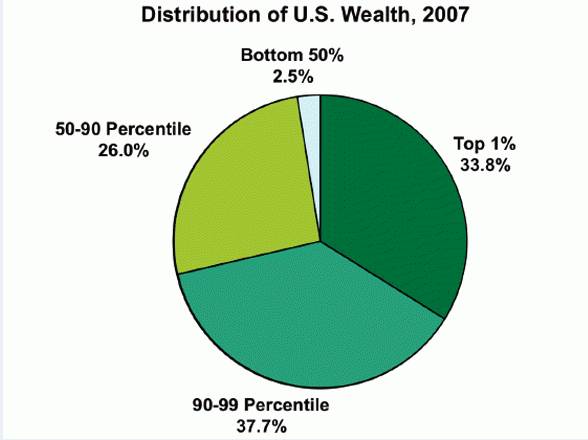
What's not appreciated is how income inequality as part of a deliberate Republican tax policy over the last century causes the bottom 90% to shrink. In order to demonstrate this I did some experiments from this web site . The bottom 90% are those below $110,000/year (2008 dollars). So, we are well into the upper middle class here.
My experiment is as follows: what does average income growth (2008 dollars) look like under Republican and Democratic Presidents. I also want to ask what was the top marginal tax rates at the time?
First up, the Republican Presidents in the 20s. Top marginal tax rate: dropped from 73% to 25%.
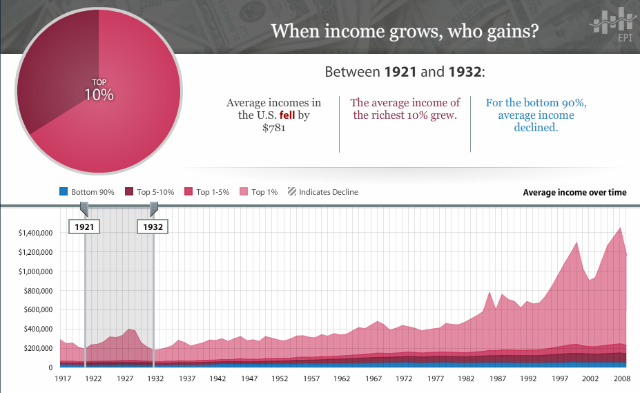
This is going to be a broken record but the top 10% gained while the bottom 90% fell. All the numbers here are in 2008 dollars and are thus adjusted for inflation. While we go through this notice how the top 1% is a significant portion of the pie.
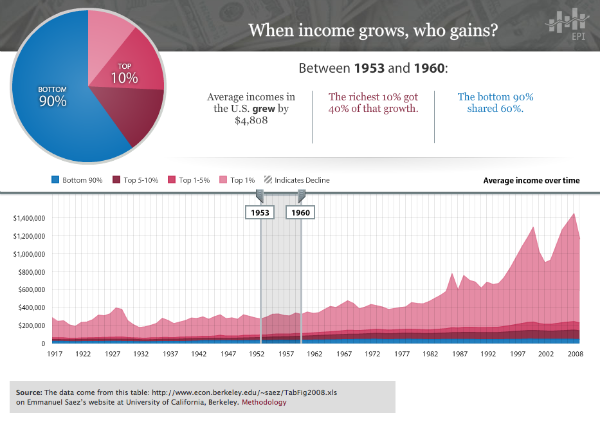
Now the Democratic Presidents that followed. Top marginal rates were increased to be between 63 and 94%. In 1952 the top rate was 92% on $400,000 of income.
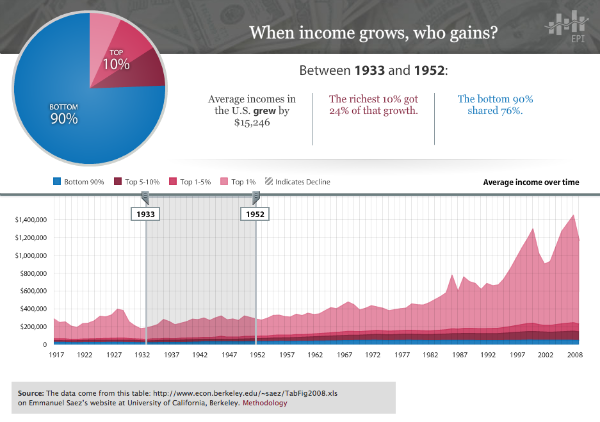
Again, this is real income growth adjusted for inflation. So, high tax rates helped everyone out but especially the lower 90%. As we shall see the rich are never "punished". They always seem to get theirs regardless of the tax rates or who is President. Now let's look at the succession of Republican and Democratic Presidents from Eisenhower to Carter.

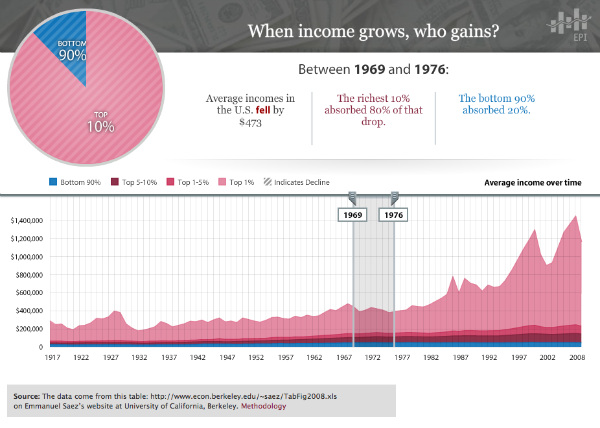
Through 1968 we had growth and then we started to shrink. What happened? The top marginal tax rate on earned income dropped to 50% in 1972. During this time period some interesting "onlies" happened:
1. The only time the bottom 90% grew under a Republican President was under Eisenhower.
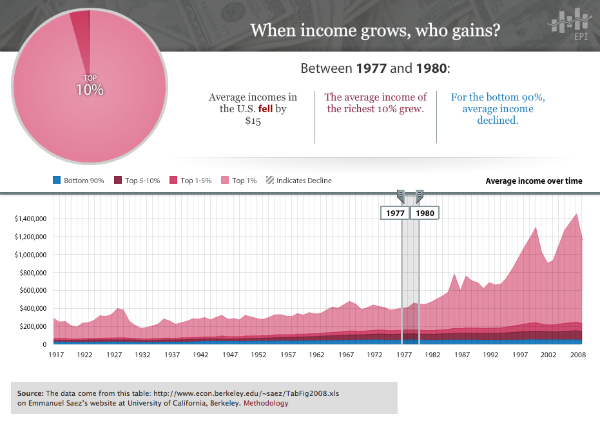
2. The only time the bottom 90% shrank under a Democratic President was under Carter.
3. The only time the top 10% shrank under any President was Nixon/Ford.
How about the great Ronald Reagan where the top marginal rate was cut to as much as 28%?
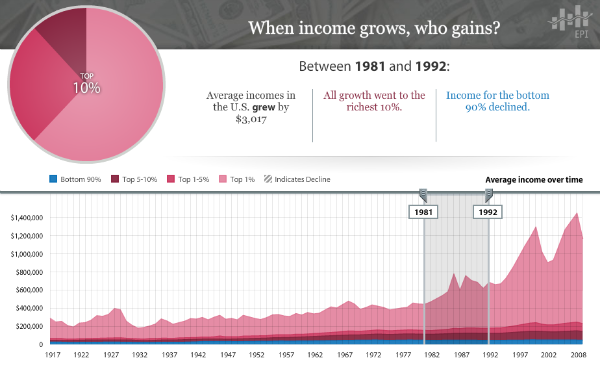
Now we have the bottom 90% continually shrinking from 1968. Note how well the top 1% does relative to both the 90th and 95th percentile. Even amongst the rich, Reagan and Bush I set up a huge income inequality. For comparison purposes, the top 5% are those who make more than $150,000 per year and the top 1% are those who make more than $370,000 per year (in 2008).
Now comes Bill Clinton who increased marginal tax rates to 39.6%.
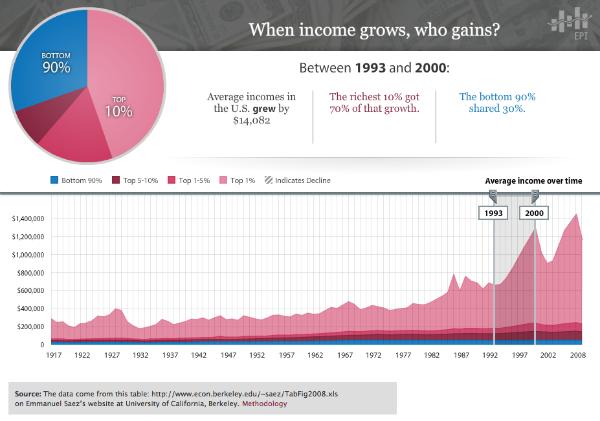
We finally get some growth in the bottom 90% but as we can see it's not nearly as good as before Reagan. Still, a positive is a positive. Finally, George W. Bush where he dropped the top marginal rate to 35%.
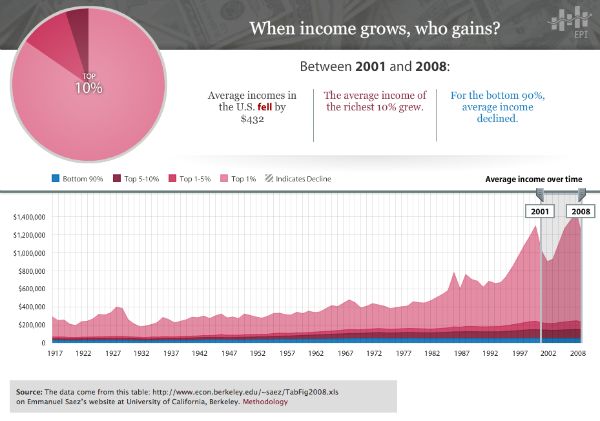
We have a winner! Average income dropped and not only did the top 10% do great the top 1% did really great. Too bad for the rest of us, though. Finally, consider the following graph of marginal tax rates and see that unlike the conventional wisdom the higher the rate the better the bottom 90% do. The top 10% do great, period.

