Every election cycle, pollsters face the same problem: They need to put out numbers showing match-ups between potential Presidential, Senate or Governor candidates.
But- how to do that, if pollsters have no way to know what the electorate is going to look like on Election Day in 9, 12 or 18 months? After all, no one could have predicted the Republican wave of 2010 in early 2009, or the Democratic Senate takeover of 2006 in early 2005.
The way that pollsters handle this situation is by simply not polling 'Likely Voters'- but 'Registered Voters'. They simply assume that turnout is going to be 100% and that everyone who is a registered voter is also going to cast a ballot.
Obviously, that isn't true. Furthermore, not every registered voter is equally likely to turn out: White voters have higher turnout rates than Hispanics do and senior voters are more likely to go to the polls than young voters, for instance.
Lastly, voters who prefer the party that is better-liked and favored in any given cycle tend to go to the polls more reliably than the rather depressed voters of the party that is in disarray.
Therefore, there is a gap between the performance of candidates among all registered voters and the voters who will eventually go to the polls. This gap usually favors the Republicans, who tend to have more support among high-turnout demographics.
Here's a table that shows the enthusiasm gap in the electoral cycles of 2004, 2006, 2008 and 2010, as estimated by StochasticDemocracy based on our database of polling data from these years.
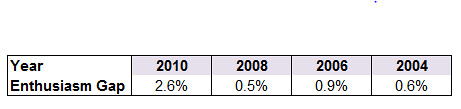
For instance, a Republican candidate would have done 2.6% better in a likely voter poll in 2010 than in a poll of registered voters. On the other hand, the gap was virtually non-existent in 2008.
We don't know yet how the 2012 electoral cycle will look like, but nevertheless would it be irresponsible to just report the results of Registered Voter polls without accounting for the Enthusiasm Gap.
That is why, in the following section outlining our initial predictions for the 2012 Presidential Election, we outline four scenarios- that the enthusiasm gap in 2012 will be the same as in 2010, 2008, 2006 or 2004. It is up to the reader's personal opinion which of these are most realistic, but no matter how your feelings about the next election are, it seems certain that turnout won't be 100%- and therefore some adjustment of Registered Voter polls is needed to not overrate the Democrats' and President Obama's electoral prospects.
How our estimates were produced
Our Presidential model consists of two parts, as most political prediction models do.
For once, we have a database of 2012 statewide polling pitting President Obama against various opponents. As of now, that database isn't too impressive- we have polls in roughly half of the states, and in most of the states in which we do have polls it is just one.
In states with more than one poll, we calculate a joint estimate using something called a Kalman filter in statistics.
The second part of our model is a so-called Weighted Least Squares Regression that basically takes the polling results we have, tries to explain them using input including polling data on Pres. Obama's approval rating, Partisan Identification, past Election results and demographic Census information.
The result of that regression is a formula that explains Pres. Obama's vote share, so that we get four formulas, matching Pres. Obama up with each of the four Republican candidates. Using this formula, we can extrapolate the polling results to the states that haven't been polled yet- for instance, we know that Pres. Obama's support against Mike Huckabee is influenced by the percentage of Suburban residents in a state, the prevalence of manufacturing industries and our estimate of Pres. Obama's approval rating, with a correction (called 'dummy variable' in statistics) built in for Northeastern states.
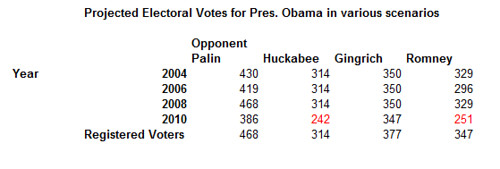
We then combine the regression estimate and our polling averages into a final prediction of Pres. Obama's vote share against any of the four leading Republican candidates among registered voters, to which our estimate of the Enthusiasm Gap (see above) is added to arrive at any of the given four scenarios for the election cycles of 2004, 2006, 2008 or 2010.
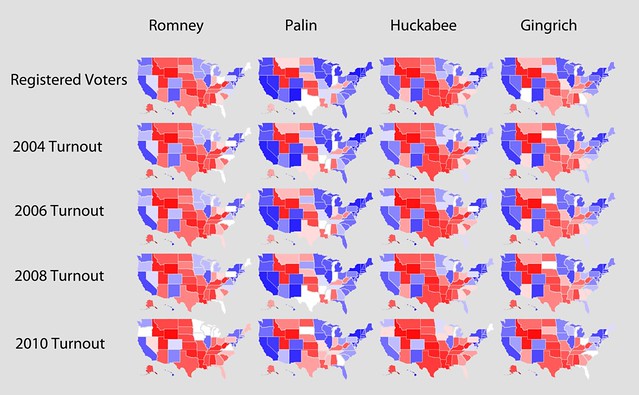
Here is, then, a table with the Electoral Maps for any candidate and any turnout scenario.
The electoral maps of 2012
In this section, we will briefly analyze Pres. Obama's electoral prospects against the four Republican candidates, using the relatively neutral 2004 turnout scenario.
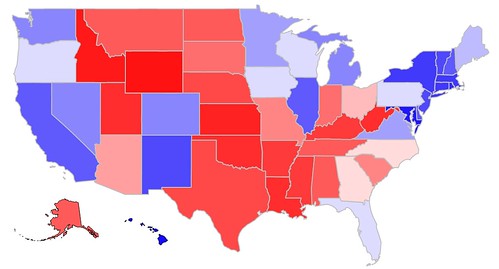
Obama vs. Romney
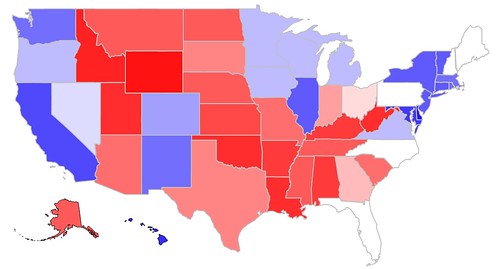
The electoral map of Pres. Obama looks decidedly different against Mitt Romney than his map did against Senator McCain in 2008. Mitt Romney has a non-trivial ability to put the Northeastern states of New Hampshire and Maine into play. He would also play better than Sen. McCain in the mid-west- he wouldn't win states like Minnesota or Iowa under most circumstances, but he would definitely come closer than Sen. McCain did.
At the same time, Romney has his weaknesses. He almost certainly wouldn't be able to put the southwestern states of Colorado and New Mexico back in play- he looks a better in Nevada due to the influence of the LDS vote though.
More importantly, in a Romney candidacy Pres. Obama would be favored to retain the Electoral Votes of Virginia and North Carolina, allowing him to win a majority of Electoral Votes under most scenarios even while having to play defense in classical blue states like Maine or Minnesota.
In 2010, Romney would have beaten Obama, in most other scenarios, he is the underdog- but he manages to keep the race somewhat closer than Sen. McCain did in 2008.
Electoral Vote Prediction:
Obama-- 329
Romney-- 209
Popular Vote Prediction:
Obama-- 51.4%
Romney-- 48.6%
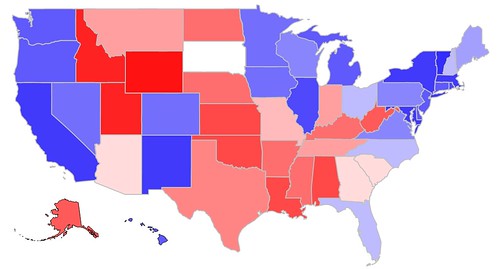
Obama vs. Huckabee
Mike Huckabee's path to victory is definitely different than Mitt Romney's. For once,
he doesn't have the same ability to put some Democratic states into play, as Nevada, New Hampshire and Maine move firmly into Pres. Obama's camp in this scenario. He also has less of a shot to win Florida and Pennsylvania than the former Massachusetts Governor would have. At the same time, Huckabee shores up the South except for Virginia- he wins Georgia, and is favored in North Carolina. Just like Romney, he wins Indiana back for the Republicans, but he has a better shot to take Ohio- Romney is just very slightly favored there, Huckabee a bit more strongly.
His bottom line is about the same as Romney's though- he would have won under 2010 conditions, but he faces an uphill fight under any other conditions.
Electoral Vote Prediction:
Obama-- 314
Huckabee-- 224
Popular Vote Prediction:
Obama-- 51.7%
Huckabee-- 48.3%
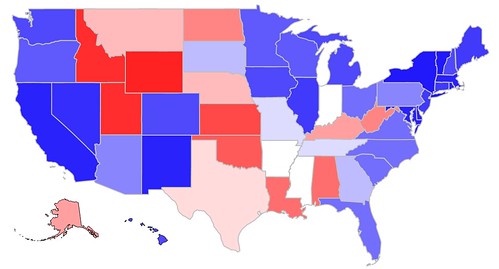
Obama vs. Gingrich
Fmr. Speaker Gingrich has a very simple electoral map in that he combines the weaknesses of Romney and Huckabee. President Obama takes Virginia with ease, is strongly favored in North Carolina and Florida and even puts Georgia into play. He also keeps the Northeast and the Midwest (safe for Indiana) barring a 2010-style wave, puts South Dakota into play and makes Arizona competitive.
Gingrich would need a Republican wave year substantially better than 2010 to even make the race close.
Electoral Vote Prediction:
Obama-- 350
Gingrich-- 188
Popular Vote Prediction:
Obama-- 54.0%
Gingrich-- 46.0%
Obama vs. Palin
Sarah Palin would lose to Pres. Obama in a landslide that no Democrat since Pres. Lyndon B. Johnson has ever seen. Pres. Obama would win the 2008 swing states like Ohio, Pennsylvania, Florida and North Carolina with ease, play very competitively in Missouri, and he puts lots of traditionally Republican territory in play. Even under 2010-style conditions, he would make Georgia competitive, and South Carolina, Arizona. In a more neutral year, he would also win South Dakota, and put Tennessee, Arkansas and Mississippi in play. In a good year for Democrats, he would additionally run even with Palin in Indiana and Texas, while winning all of the aforementioned states. He could also start thinking about campaigning in some of the Palin-leaning states- like Kentucky, Alaska, Montana, Nebraska and West Virginia.
Bottom line: Palin would lose, and currently it looks like she would do so in a land-slide no matter what the political environment looks like.
Electoral Vote Prediction:
Obama-- 430
Palin-- 108
Popular Vote Prediction:
Obama-- 57.1%
Palin-- 42.9%
Summary
As of now, Pres. Obama's reelection prospects are looking very good. Unless the Republicans manage to nominate one of the more electable candidates (Mitt Romney or Mike Huckabee) and at the same time repeat the wave of 2010, he seems poised to be re-elected.
