Welcome to the Climate Change News Roundup for 15 May 2011. My upfront diary tonight will be an update on Arctic sea ice and some comments on short-term observed climate. Note that I started this series as a result of work done by the late Johnny Rook. We honor him here.
Inspired by the late Johnny Rook's Climaticide Chronicles, this is an occasional series on the state of Arctic sea ice.
I've not written on the Arctic for quite awhile. Admittedly, it's sometimes more interesting to write when there's something that appears to be newsworthy in that region ... and sometimes increased stress in one's life gets in the way as well. So it is with me these days ... but I'm working on it and working it out, with some help. I'll summarize what's gone on since January 2011 below.
What's it like up there now? Here's a picture at one of many points on the Arctic Coast: Barrow AK, where at 5 p.m. Alaska time on 14 May 2011 it was 26°F and cloudy, with light winds. There's still 9" of snow on the ground there. In case you're wondering what would be "normal" at Barrow: High 24°F, Low 14°F.
Short-Term Climate in the Arctic Up to 1 February 2011
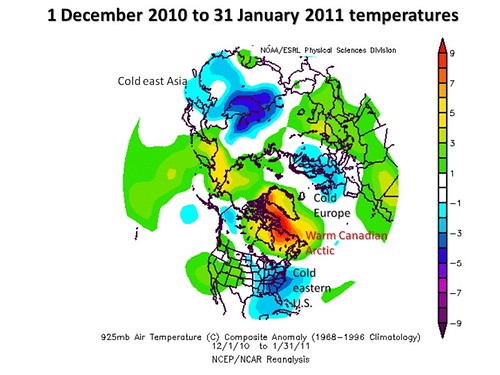
You may recall that early in the 2010-11 winter, it was cold and stormy in many mid-latitude locations, similar to winter 2009-10. This was true in the U.S., even though the El Niño of 2010 had switched to a pretty strong La Niña during last summer. La Niñas typically feature warm, dry weather across the southern tier of the U.S. and up the Atlantic coast about as far as at least Washington DC. Not so this past winter. It was cold, and except around DC, it was snowy. But temperatures during that period in the Arctic were warmer than normal, especially over North America. There has been some conjecture that this is the result of the decrease in Arctic sea ice over the last 30 years, though nothing conclusive has been determined.
The graphics showing the mean departure from normal 925-hPa (that's the same as millibars) temperatures (in °C) for the period 1 December 2010 through 31 January 2011.
Dec. 1, 2010 to Jan. 31, 2011 departure from normal 925-hPa (3000 ft above sea level) temperature
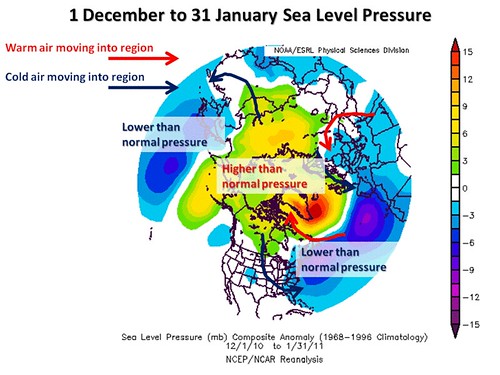
Why were these patterns observed? What's called the Arctic Oscillation (AO) was in its negative phase; this meant higher than normal pressures in the Arctic, and a storm track further south than normal. Europe experienced its most severe early winter in about 50 years; places in the southern U.S. had their first white Christmases in at least as long, and in a few cases, their first ever. The sea level pressure mean departure from normal for the 1 Dec. 2010 through 31 January 2011 pattern is shown in the graphic below.
Dec. 1, 2010 to Jan. 31, 2011 departure from normal mean sea level pressure
Short-Term Climate in the Arctic After 1 February 2011
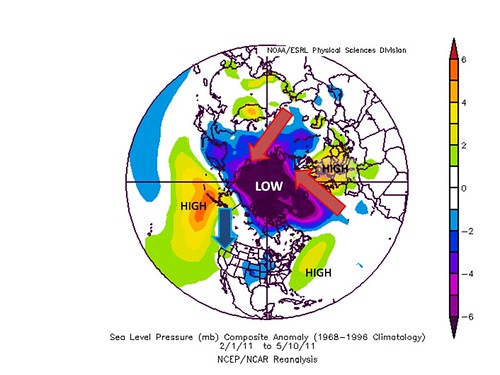
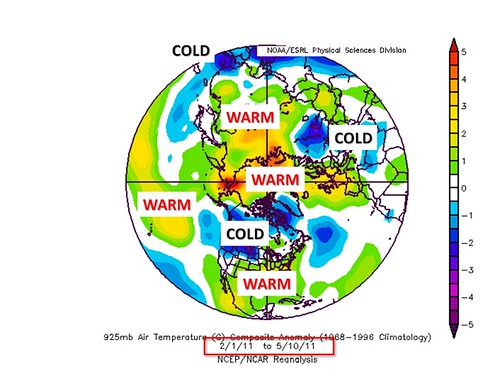
There was a significant shift in atmospheric circulation that occurred right about the end of January 2011. The AO went strongly positive, and remained positive through most of the time up to last week. This meant a strong polar low pressure area, which tends to lock up cold air to the north and allow the mid-latitudes to warm. Warming was indeed seen in Europe and the U.S. east of the Rockies, while it was cold to the north in Canada. England, for example, had its warmest April on record. While this was going on, however, the high latitudes stayed pretty much warmer than normal through the period, particularly over the Arctic Ocean, Scandinavia, and northern Asia. This was the result of stronger than normal southwest winds from the mid-latitude Atlantic Ocean into the Arctic basin north of Scandinavia and western Russia, and into the Asian Arctic from central Asia. The colder than normal temperatures in the Arctic and sub-Arctic parts of western North America resulted from greater than normal northerly flow into these regions. Graphics of 1 February through 10 May 2011 mean departures from normal sea level pressure and temperature (at 3,000 feet above sea level) are shown below.
Feb. 1 - 10 May 2011 mean departure from normal sea level pressure
Feb. 1 - 10 May 2011 mean departure from normal 925-hPa (3000 feet above sea level) temperatures
Arctic Sea Ice since 1 December 2010
The maximum sea ice extent this past winter was well below normal, as was reported on 5 April 2011 by the National Snow and Ice Data Center (NSIDC). The maximum value was essentially tied with 2006 for the lowest daily maximum value in the satellite record (since 1979). March 2011 was tied for second lowest mean sea ice extent with 2006. This ice was somewhat older than in previous years, with nearly 30% of it multiyear ice. The amount more than 2 years old was up to about 17% or so, with the remainder 1-2 year old ice. Typically, older ice is thicker ice, so ice age is an approximate surrogate for sea ice volume.
There is a model run by the University of Washington that uses actual weather data and sea ice thickness observations to develop a sea ice volume analysis. The model is called PIOMAS, and it was initialized with ice thickness data from 1979 and forced with observed conditions from that point to 2 May 2011 (and will continue to be updated periodically). Observed thicknesses from various sources (submarines, satellite observations, etc.) are assimilated into the model when available, which with the sea ice area gives the sea ice volume (height x width x thickness = volume).
The mean daily departure from normal (normal = PIOMAS mean daily values from 1979-2009) Arctic sea ice volume time series from PIOMAS is shown below. The linear trend and the 95% confidence level around that trend are shown in blue and gray shading, respectively. I've hand-fitted a red trend curve showing an accelerating decline in volume over time, particularly since 2002.
Time series of estimated Arctic sea ice volume via PIOMAS, 1979 to present
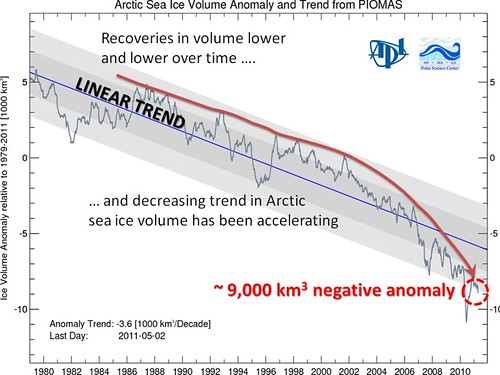
We are 9,000 km3 below the 1979-2009 normal, which is shown below for the annual cycle (maximum volume in April, minimum in September). The present volume is annoated on the mean annual cycle graphic, and is about 19,500 km3.
Annual cycle of Arctic sea ice volume, mean for 1979-2009
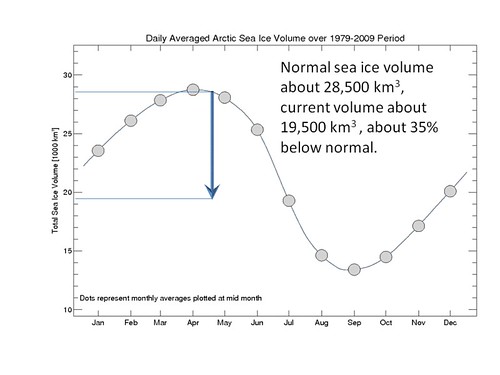
It appears that last winter's volume maxed out at about 20,000 km3. I estimate that 1979's maximum was about 34,000 km3, so only about 59% of 1979's volume has remained, and would take 41% less heat to remove.
Arctic sea ice area
Arctic sea ice has been relatively slow to melt through much of April, as reported on May 5 by the NSIDC. The area loss trend has accelerated since the last week of that month, however. Below, the graphics show both the slow start and the more recent acceleration.
The NSIDC 1 February to 31 May time series of Arctic sea ice extent: 2011 (through 14 May only), 2007, and the 1979-2000 mean and 95% confidence interval
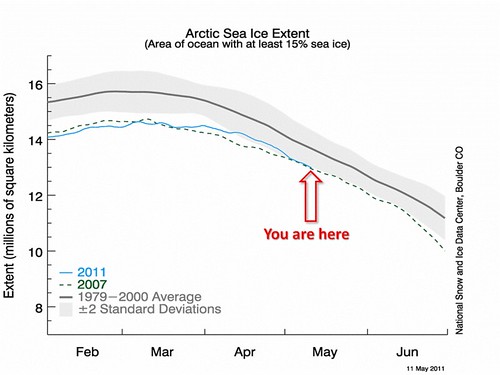
We're at the bottom edge of the 95% confidence interval as of the most recent measurement. The value is the 4th lowest in the last 10 years, according to another ice analysis center jointly run by the University of Alaska and the Japan Aeronautical Exploration Agency (JAXA).
How is the sea ice distributed? That's in the next graphic, annotated with areas that are either near normal or below normal in sea ice extent. There were no major areas of above normal sea ice extent. The graphic also has color shading that indicates the fraction of the ocean covered with ice (sea ice concentration).
University of Illinois Urbana-Champagne Arctic sea ice concentration, 14 May 2011
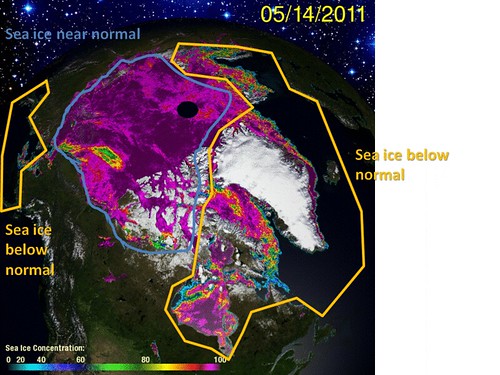
The entire Atlantic and Eurasian Arctic Ocean sector has below normal concentrations, probably the result of the strong southwest flow from the mid-Atlantic into these areas around the anomalously strong Arctic low pressure area that has persisted on average since the end of January. Coverage is also below normal south of eastern Siberia in the Bering Sea and the Sea of Okhotsk.
Near-term expected weather/climate in the Arctic
The Arctic Oscillation is expected to be somewhat in its negative phase over the next 15 days, while the North Atlantic Oscillation is expected to be close to neutral. The forecast for both is shown next from 11/12 May 2011; the forecasts have not changed materially since then.
AO and NAO time series history and forecast
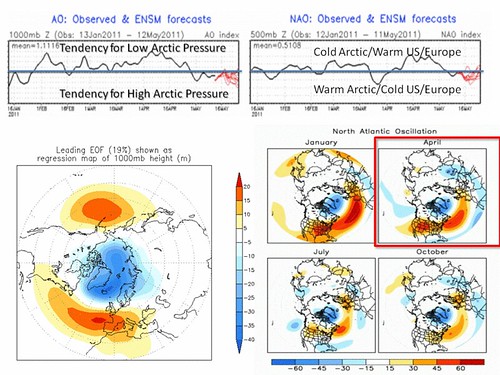
What does this mean for the summer minimum ice extent in 2011? Well, that depends on what short-term climate patterns emerge for the summer season. Typically, spring patterns are highly variable as the atmosphere-land-ocean system adjust to rapidly changing incoming solar radiation intensity and the land surface comes to life from its winter dormancy. So as the NSIDC said at the end of its April 2011 report: "How [the positive AO] will affect observed sea ice conditions at the end of this summer remains to be seen."
And with that, we move on to the Climate Change News!
Climate Change Science
- Journal retracts global warming study
Well, on the one hand, we have this, which was diaried earlier today in a recommended diary by tomasyn. They're focusing on plagerism, but they should likely be focusing on the potential falsehoods in the Wegman report instead.
- David Evans (but I refuse to link to Fox News' story on my Google News list today)
And on the other hand, this emerge from the muck. He's been on climate "skeptics'" friends list since 2006, when he decided to bolt from the Australian Greenhouse Office, which was designing a carbon accounting system for the government. Now he's apparently put out (last November) a "paper" for laypeople to -delude- inform them that climate scientists are in a big conspiracy to take away their way of life. I think Faux News put up a story about him to counter the one about Wegman.
- National Research Council: America's Climate Choices
Four videos can be viewed from links on the left hand side. I actually "attended" the webinar on the third one.
Titles:
- Adapting to the Impacts of Climate Change
- Informing an Effective Response to Climate Change
- Limiting the Magnitude of Climate Change
- Advancing the Science of Climate Change
Money quotes from Key Findings:
- Because of time-lags inherent in the Earth's climate, the observed climate changes as greenhouse gas emissions increase reflect only about half of the eventual total warming that would occur for stabilization at the same concentrations. Moreover, emission reductions larger than about 80 (relative to whatever peak global emission rate may be reached) are required to approximately stabilize carbon dioxide concentrations for a century or so at any chosen target level (e.g., 450 ppmv, 550 ppmv, 650 ppmv, 750 ppmv, etc.).
- Future stabilization targets correspond to altered states of the Earth's climate that would be nearly irreversible for many thousands of years, even long after anthropogenic greenhouse gas emissions ceased. Ed.: Another argument for "the sooner the better."
- A number of key climate changes and impacts for the next few decades and centuries can now be identified and estimated at different levels of warming. Many impacts can be shown to scale with warming (see Figure S.5). Scientific progress has resulted in increased confidence in the understanding how global warming levels of 2, 3, 4, 5°C, etc. affect precipitation patterns, extreme hot seasons, streamflow, sea ice retreat, reduced crop yields, coral bleaching, and sea level rise.
Climate change in US politics
- Siemens US Chief Concerned by Inattention to Climate Change
Another way Republican know-nothing/Luddite behavior hurts the U.S. ... watch Siemens pull out of investing here. "Without legislation requiring cuts to emissions of carbon dioxide and gases linked to global warming, a national mandate for renewable energy production would spur more investment in innovation than tax cuts would, Spiegel (Siemens US Chief Executive) said.
Climate change and world politics
- Great Britain: Could the Treasury seize control of low carbon policy?
Renewable energy industry fears under-reported "control framework" will force straitjacket on low carbon policy ... sounds like Cameron at work?
- Great Britain: A Government that Is Not Green Enough
David Cameron is reported to have resisted pressure from some Cabinet ministers to water down Britain's emissions reduction targets. The Government will announce today that it will act on the recommendations of the independent Committee on Climate Change (CCC) and ensure that our national emissions fall by 50 per cent on 1990 levels by 2025 .... but yet ...This Government has authorised the use of "hydraulic fracturing" .... and deep water drilling off the British coast. They report, you decide ;-).
- Australia: Government Rejects AU$40 Tax Per Ton on Carbon Emissions
With natural gas prices rising in Australia, the only way it'll make economic sense (externalities notwithstanding) to switch from coal to natural gas would be to price carbon at AU$40 per ton. It looks like they may not set it at more than $30/ton.
Climate Change and Wildlife
- Feds announce reviews for 251 imperiled species
This is the result of a compromise with environmental groups. Two species specifically though to be threatened by global warming were left off the list, apparently. Final decisions would be due by September 2016. It would settle pending litigation between the Interior Department and Denver-based WildEarth Guardians.
- Ontario Green Energy Project Could Kill, Harm, and Harass Endangered Species
"We’re totally supportive of wind, but at the same time, you can’t be putting up projects in the middle of areas where you know there’s going to be a significant ecological impact. It doesn’t make sense,” said director of conservation and education Anne Bell. “It’s not green. It’s green that’s not green.”
Climate Change and Forests
- The IPCC Report Suggests We Cut Down Trees?
Yeah, I said "Huh??!?" also. But apparently this refers to the quantification of biomass burning as a renewable resource. Read more for an interesting critique that not everyone may have noticed.
Climate Change and Food/Health
- FAO And Minster Of Agriculture Validate Food Security Study
Of course, this study is reported in Gambia, where they care a great deal about world food security as a matter of policy, since they are among those likely to be adversely impacted. Quote: "“The high food prices have become a matter of survival for some 2 billion people worldwide. The world’s poorest spend up to 80% of household income on the food they eat to survive. Most live in rural areas and make their living from agriculture,” the FAO Representative in the Gambia, Dr. Babagana Ahmadu, said. "
That's all I have time for tonight ... bon appitit!
