Borrowed from roguemapper's VRA guide. Please see the comments for roguemapper's and andgarden's enlightening opinions on the legality of this map as well as the applicability of Bartlett, LULAC, and Bush v. Vera.
Bartlett v Strickland: This 2009 ruling sought to establish a ‘bright-line 50% threshold’ for the drawing of VRA compliant districts. In short, states are not required to draw ‘crossover’ or ‘influence’ districts in which a minority forms a plurality, but not a majority, of the district population. This goes back to the first Gingles precondition wherein the VRA is invoked only where a minority group is large enough and lives closely enough together so that a relatively compact district in which the group constitutes a majority can be drawn.
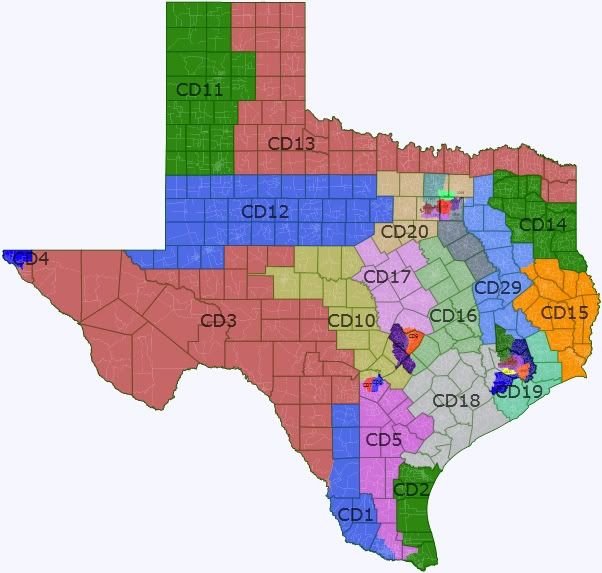
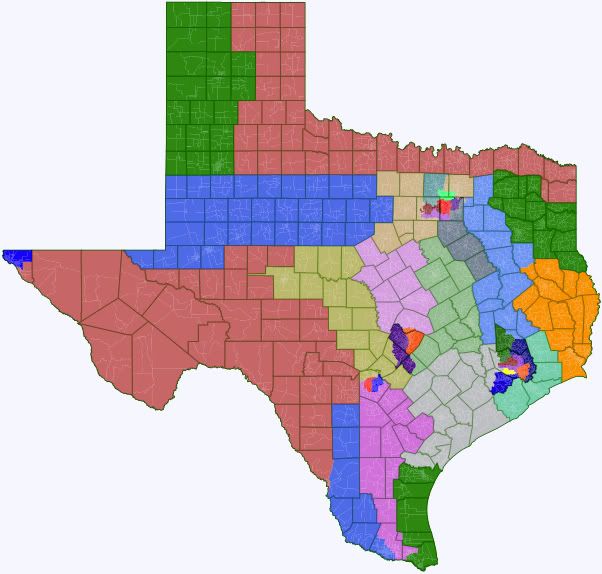
The three African American districts in Texas are, under the logic of Bartlett, not required by the VRA because they aren't, nor have they ever been, majority African American. The only way to draw a map favorable for the Democrats in Texas lies in dismantling the 9th, 18th, and 30th, and I've done just that while maintaining every current Hispanic VRA district.
For analysis, I'm taking the rounded average between Obama's vote share and the average vote share from 2002-2010 of the two party vote in Presidential and Gubernatorial elections. I'll call this the Democratic Party Score. I'm doing this average to account for demographic changes that make districts slightly better for Democrats as time passes that won't necessarily be caught by using only the congressional vote share. I'm also only using VAP numbers below the fold. All population variations are beneath 2500. There are 19 districts under this map that are swing or better. Please comment. The only way I'll be able to make a better map is with your collective input.
0-42% D: Safe Republican
42-44% D: Likely Republican
45-47% D: Lean Republican
48-52% D: Swing District
53-55% D: Lean Democratic
56-58% D: Likely Democratic
58%+ D: Safe Democratic
This diary has been posted to DK Elections, an official Daily Kos sub-site. Please read the DKE Mission Statement. Our focus is on electoral politics rather than policy or preference. Welcome aboard!
1: Vacant. McAllen, Mission, Pharr.
88% Hispanic. 10.1% White.
Obama: 68.9%, Democrats: 67.3%, Democratic Party Score: 66. Safe Democratic.
2: Blake Farenthold (R). Brownsville, Corpus Christi.
74.7% Hispanic. 24.9% White.
Obama: 55.1%, Democrats: 55.4%, Democratic Party Score: 55. Lean Democratic.
This district gave us a surprise in 2010 when longtime Representative Solomon Ortiz lost. In fact, Solomon Ortiz was the only person ever to hold this district. The district has flirted with Republicans every so often, even Cameron county (Brownsville) voted for Bush in 2004. To move the district slightly to the left, I've removed the most Republican part of the district by taking out San Patricio county.
3: Henry Cuellar (D). Laredo, El Paso, Big Bend.
72.5% Hispanic. 25.4% White.
Obama: 51.9%, Democrats: 53.4%, Democratic Party Score: 52. Swing District.
This is the visual successor to the current 23rd, except - in a wash for district partisan lean - I've removed Bexar County and replaced it with the rest of Laredo. I can't actually imagine a Republican winning here five years from now given that most of the Republican counties on the Llano Estacado that are within this district are losing voters while the Democratic counties along the border are gaining them.
4: Silvestre Reyes (D). El Paso.
77.7% Hispanic. 17.0% White.
Obama: 65.1%, Democrats: 61.4%, Democratic Party Score: 63. Safe Democratic.
5: Ruben Hinojosa (D). Harlingen, San Antonio, Edinburg, Weslaco.
68.8% Hispanic. 26.9% White.
Obama: 53.6%, Democrats: 53.7%, Democratic Party Score: 54. Lean Democratic.
Instead of having a district that stretches from Laredo to San Antonio's south side, I thought it was more visually appealing to have one that stretches from The Valley. This is another district where the trends are against Republicans (granted, this is the case everywhere in Texas): Democratic parts of the district are gaining at the expense of Republican parts of the district.
6-9: Covered below.
10: Quico Canseco (R) (?). San Antonio, San Angelo.
68.6% White. 28.4% Hispanic.
Obama: 28.8%, Democrats: 26.5%, Democratic Party Score: 28. Safe Republican.
This is the visual successor to Lamar Smith's 21st, except it takes in San Angelo and divests itself from Kerrville and the Alamo Heights area.
11: Randy Neugebauer (R). Lubbock, Amarillo.
61.4% White. 29.7% Hispanic.
Obama: 26.6%, Democrats: 26.7%, Democratic Party Score: 27. Safe Republican.
Lubbock and Amarillo are, culturally, more similar than Amarillo and Wichita Falls. The same can be said about Lubbock and Abilene. Therefore, I took Amarillo away from Thornberry and Abilene away from Neugebauer, which has the effect of smoothing the lines out.
12: Mike Conaway (R). Midland, Odessa, Abilene, and Big Spring.
61.9% White. 30.8% Hispanic.
Obama: 24.1%, Democrats: 28.2%, Democratic Party Score: 26. Safe Republican.
This district, by gaining Abilene and losing San Angelo (which, IMO, being on the edge of the Hill Country, is better placed with Fredericksburg etc.) essentially turns into an I-20 corridor district.
13: Mac Thornberry (R). Wichita Falls, Sherman, Denison, Texarkana.
76.1% White. 11.6% Hispanic. 9.5% African American.
Obama: 27.0%, Democrats: 34.2%, Democratic Party Score: 31. Safe Republican.
Instead of having a Panhandle dominated district, I've reengineered this to be a Red River district.
14: Louie Gohmert (R). Tyler, Marshall, Longview.
70.4% White. 15.4% African American. 12.1% Hispanic.
Obama: 29.5%, Democrats: 33.6%, Democratic Party Score: 32. Safe Republican.
By losing Nacogdoches and Lufkin (which are now tied to Beaumont), this becomes the eastern answer to the 12th: an I-20 corridor district.
15: Vacant. Beaumont, Port Arther, Nacogdoches, Lufkin.
66.5% White. 19.5% African American. 11.1% Hispanic.
Obama: 36.9%, Democrats: 45.3%, Democratic Party Score: 42. Likely Republican.
One of the grossest injustices of Republican redistricting in Texas is that Beaumont is tied to the Houston suburbs. This corrects that and provides an opening for future Democrats. Obama's share relative to Democratic performance is probably deflated due to his race. The fact that the Democrats running here against incumbents Kevin Brady (The Woodlands) and Ted Poe (Humble) in 2008 and 2010 got 45.3 percent as an average is absolutely astounding.
16: Bill Flores (R). Waco, Bryan-College Station.
65.0% White. 19.7% Hispanic. 11.7% African American.
Obama: 36.7%, Democrats: 39.0%, Democratic Party Score: 38. Safe Republican.
This district has been made substantially more minority by the removal of Fort Worth suburban counties Johnson and Hood. If Chet Edwards wanted to run again, I'd call it a tossup. Against anyone else, though, Bill Flores is safe.
17: Vacant. Killeen, Fort Hood, Belton, Temple, Georgetown.
65.0% White. 18.3% Hispanic. 11.9% African American.
Obama: 38.5%, Democrats: 35.3%, Democratic Party Score: 37. Safe Republican.
This district loses Round Rock and Cedar Park, the most Democratic (and I say that loosely) area of the district. As a consequence, it also does not have an incumbent.
18: Vacant. Katy, Victoria.
58.3% White. 38.6% Hispanic. 8.1% African American.
Obama: 32.9%, Democrats: 33.4%, Democratic Party Score: 33. Safe Republican.
Doggett's district contracted into Austin, so what was once half of Paul's district picks up alot of that rural area while losing Brazoria (Lake Jackson, Paul's home), Galveston, and Chambers counties.
19: Ron Paul (R). Galveston, Pearland.
62.3% White. 21.3% Hispanic. 11.8% African American.
Obama: 35.9%, Democrats: 38.5%, Democratic Party Score: 37. Safe Republican.
20: Kay Granger (R) (?). Fort Worth, Decatur, Cleburne.
80.1% White. 13.0% Hispanic.
Obama: 27.1%, Democrats: 28.1%, Democratic Party Score: 28. Safe Republican.
21-28: Covered below.
29: Ralph Hall (R). Athens, Palestine, Huntsville.
73.6% White. 12.6% Hispanic. 11.6% African American.
Obama: 28.8%, Democrats: 32.5%, Democratic Party Score: 36. Safe Republican.
Instead of covering Northeast Texas, Ralph Hall gets the left overs, which stretch from the Dallas exurbs to the Houston exurbs.
30-36: Covered below.
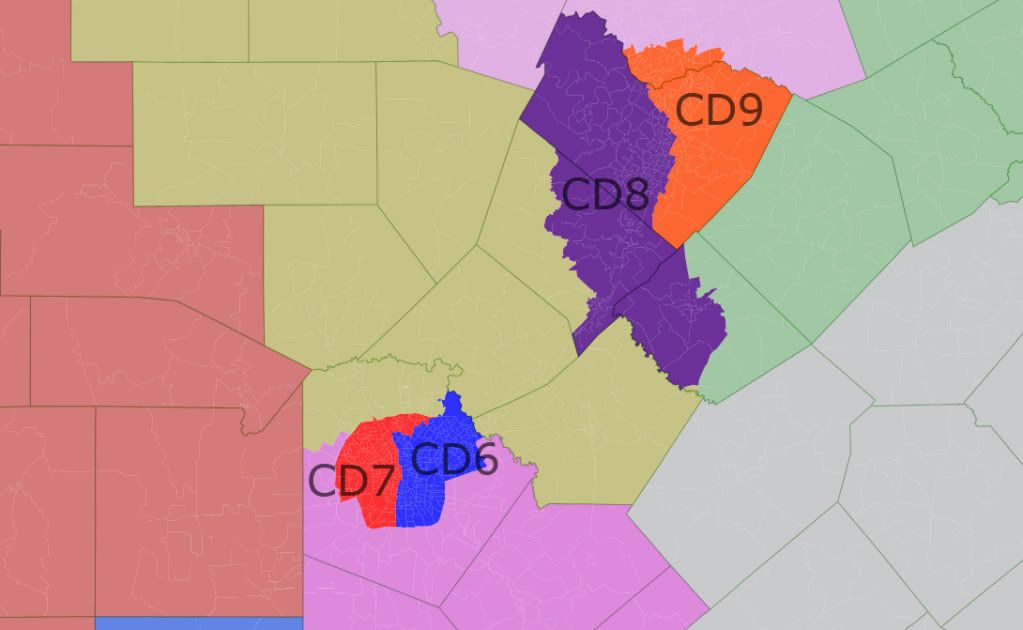
6: Charles Gonzalez (D) v. Lamar Smith (R). San Antonio.
54.0% Hispanic. 32.8% White. 10.0% African American.
Obama: 56.1%, Democrats: 51.6%, Democratic Party Score: 54. Lean Democratic
The first incumbent pairing is between two long time representatives. I'd give the edge to Gonzalez based on the good will built up by his family's history in public service.
7: Vacant. San Antonio.
61.7% Hispanic. 29.0% White. 4.9% African American.
Obama: 56.4%, Democrats: 52.2%, Democratic Party Score: 54. Lean Democratic.
8: Lloyd Doggett (D) v. Michael McCaul (R). Austin, San Marcos.
64.5% White. 25.6% Hispanic. 4.8% Asian.
Obama: 59.9%, Democrats: 53.6%, Democratic Party Score: 57. Likely Democratic.
The second incumbent pairing favors the Democrat heavily. Instead of splitting Austin at the river - which is what I've typically done - I've split it roughly at I-35 and US 183. This had two good outcomes: 1) Both districts become substantially more Democratic (I don't know why), and 2) The "vacant" district is one that is substantially more Hispanic. In order to keep the district in Likely Democratic territory, I gave the Republican western portions of Hays County to Canseco and reached into Lockhart (which, to my surprise, is extremely Democratic: one voting district there gave Obama 80%).
9: John Carter (R). Austin, Round Rock, Cedar Park.
48.4% White. 31.9% Hispanic. 11.3% African American. 6.6% Asian.
Obama: 62.5%, Democrats: 54.2%, Democratic Party Score: 58. Safe Democratic.
Yeah. John Carter can run here, but he isn't going to win here. Granted, he could run in the vacant 17th (which is literally just outside Round Rock) and win easily.
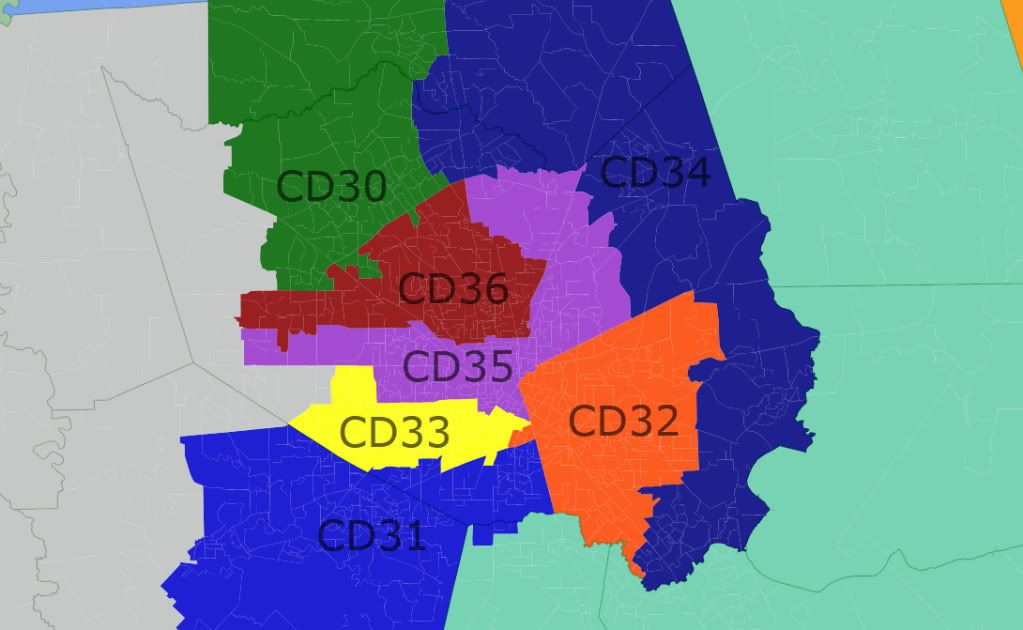
30: Vacant. Houston, Conroe.
67.7% White. 17.3% Hispanic. 7.4% African American. 6% Asian.
Obama: 26.8%, Democrats: 22.3%, Democratic Party Score: 25. Safe Republican.
This is the most Republican district in the state (very surprisingly, I would have expected one of the Llano Estacado/Panhandle districts to hold that title.
31: Al Green (D) v. Pete Olson (R). Houston, Sugarland.
32.6% African American. 27.5% White. 24.2% Hispanic. 14.2% Asian.
Obama: 62.0%, Democrats: 57.3%, Democratic Party Score: 60. Safe Democratic.
Pete Olson would be screwed against Al Green.
32: Gene Green (D). Houston, Pasadena.
59.9% Hispanic. 24.2% White. 11.9% African American.
Obama: 54.9%, Democrats: 56.1%, Democratic Party Score: 56. Likely Democratic.
Gene Green's current district is slightly more Hispanic.
33: John Culberson (R). Houston.
33% Hispanic. 30.9% White. 21% Hispanic. 13.5% Asian.
Obama: 58.4%, Democrats: 52.3%, Democratic Party Score: 55. Lean Democratic.
Culberson will be screwed in a few years given the demographic trends. I'm sure I could have made this district Likely Democratic with a few changes as it is only one point beneath that classification on my Party Score, which would give us 5 Likely and Safe seats in Houston alone.
34: Ted Poe (R) v. Kevin Brady (R). Houston, Humble, The Woodlands.
63.9% White. 21.0% Hispanic. 9.4% African American. 4.1% Asian.
Obama: 32.1%, Democrats: 29.5%, Democratic Party Score: 31. Safe Republican.
All that matters here is the Republican primary. I'd put my money behind Ted Poe because more of this district comes from his current constituency.
35: Sheila Jackson Lee (D). Houston.
38.3% White. 34.8% Hispanic. 21% African American. 4.6% Asian.
Obama: 57.7%, Democrats: 53.6%, Democratic Party Score: 56. Likely Democratic.
I wouldn't give her much chance to win a primary anymore, but I could honestly care less. I find her obnoxious. Her going on stage at the Grammy's to honor Michael Jackson was just... annoying. Let musicians do that instead, please.
36: Vacant. Houston.
49.1% Hispanic. 22% African American. 21.7% White. 6.2% Asian.
Obama: 61.6%, Democrats: 57.1%, Democratic Party Score: 59. Safe Democratic.
This district would probably be the subject of a VRA lawsuit. I'm sure that you could change the lines a bit to make it majority Hispanic without impairing the other districts.
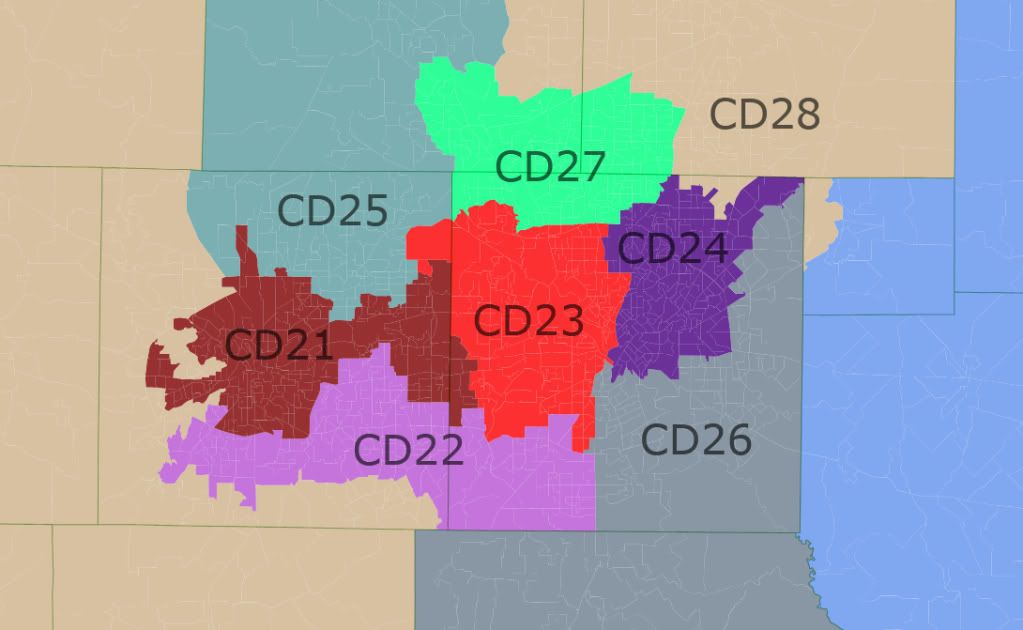
21: Vacant.
40.6% White. 36.9% Hispanic. 16.8% African American.
Obama: 56.4%, Democrats: 53.1%, Democratic Party Score: 55. Lean Democratic.
This district would be ideal for Wendy Williams.
22: Vacant.
43.6% White. 29.4% African American. 19.7% Hispanic. 5.6% Asian.
Obama: 56.6%, Democrats: 50.7%, Democratic Party Score: 54. Lean Democratic.
Also a good district for Wendy Williams.
23: Pete Sessions (R).
42.9% Hispanic. 35.7% White. 13.7% African American. 6.1% Asian.
Obama: 56.2%, Democrats: 51.2%, Democratic Party Score: 54. Lean Democratic.
I'm not sure he'd be screwed right away, but a few cycles for now he'd be gone.
24: Vacant.
42.3% White. 32.1% Hispanic. 18.3% African American. 5.8% Asian.
Obama: 55.2%, Democrats: 49.1%, Democratic Party Score: 52. Swing District.
The only district which Obama won that Democrats lost.
25: Vacant.
75.8% White. 12.8% Hispanic. 5.2% African American. 4.4% Asian.
Obama: 33.0%, Democrats: 27.7%, Democratic Party Score: 30. Safe Republican.
26: Eddie Bernice Johnson (D) v. Jeb Hensarling (R) v. Joe Barton (R).
43.2% White. 27.0% African American. 26.4% Hispanic.
Obama: 54.2%, Democrats: 51.8%, Democratic Party Score: 53. Lean Democratic.
I'm honestly not sure Johnson would be able to win her primary. Whatever... Having a white Democrat be our nominee would probably bump this up to Likely Democratic anyway. Having Johnson as our nominee would probably take it the other way: Swing.
27: Kenny Marchant (R) v. Michael Burgess (R).
61% White. 17.4% Hispanic. 8.7% African American. 11.0% Asian.
Obama: 40.6%, Democrats: 31.9%, Democratic Party Score: 36. Safe Republican.
I'm actually surprised Obama did this well here relative to Democratic generic performance. Marchant would probably win the primary here.
28: Sam Johnson (R).
66.9% White. 14.1% Hispanic. 8.9% Asian. 8.1% African American.
Obama: 35.6%, Democrats: 27.5%, Democratic Party Score: 32. Safe Republican.
 The breakdown for my complete demmymander/democratic dummymander:
Safe Republican: 16
Likely Republican: 1
Lean Republican: 0
Swing District: 2
Lean Democratic: 9
Likely Democratic: 3
Safe Democratic: 5
FYI: Democrats only have 9 seats currently. At bare minimum this map would produce 5 seats, but usually around 8. I'm sure that in a neutral year we could win most of the lean districts, which would give us more than we've had since 2006 and around the number we had before the Delay-mander... The average Democratic Party Score is 45, meaning that Democrats' (including Obama) average vote in 2008 and 2010 was 45%.
