You can't take it any further than what I've done here because of geographic constraints (I.E. unpacking El Paso is next to impossible). The only three safe Democratic districts are in El Paso and Houston. The rest are barely lean Democratic or swing.
I'm using the same method for categorizations as my last post:
For analysis, I'm taking the rounded average between Obama's vote share and the average vote share from 2002-2010 of the two party vote in Presidential and Gubernatorial elections. I'll call this the Democratic Party Score. I'm doing this average to account for demographic changes that make districts slightly better for Democrats as time passes that won't necessarily be caught by using only the congressional vote share. I'm also only using VAP numbers below the fold. All population variations are beneath 2500. Please comment. The only way I'll be able to make a better map is with your collective input.
0-42% D: Safe Republican
42-44% D: Likely Republican
45-47% D: Lean Republican
48-52% D: Swing District
53-55% D: Lean Democratic
56-58% D: Likely Democratic
58%+ D: Safe Democratic
This map is probably not VRA compliant. I only have one Hispanic district in the Houston area, but two are possible. I don't have any Hispanic districts in DFW, but one is possible. A few precinct switches would solve both problems easily without impairing the functionality of this map, but I'm not going to bother with it. If we ever recapture the the trifecta here (yeah, right), I would be happy with such a "hail mary" map only because it would force the national party to spend money here on GOTV and registration drives to ensure that they'd win the bulk of the swing seats.
I'm still convinced that I can make another swing district in the Houston area by tapping into the two safe seats. It'd probably end up with them being 2 lean and 1 new swing. If I can do that, I'll republish under "22 Winnable Seats"
This diary has been posted to DK Elections, an official Daily Kos sub-site. Please read the DKE Mission Statement. Our focus is on electoral politics rather than policy or preference. Welcome aboard!
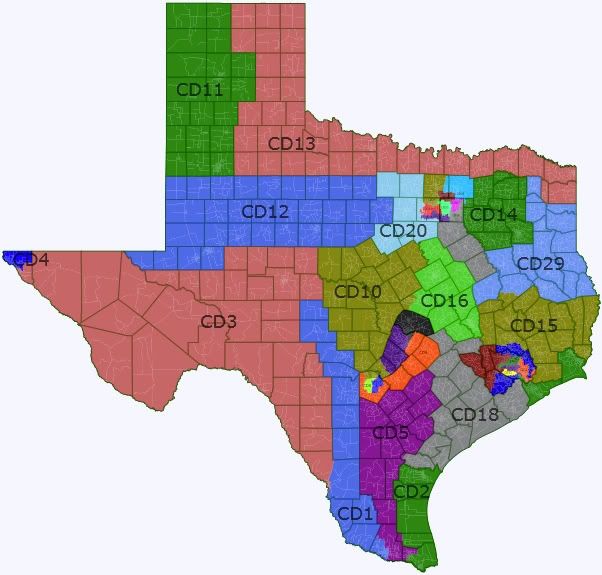
1: Vacant. McAllen, Mission, Pharr.
75.6% Hispanic. 22.0% White.
Obama: 54.2%, Democrats: 52.6%, Democratic Party Score: 53. Lean Democratic.
2: Blake Farenthold (R). Brownsville, Corpus Christi.
70.7% Hispanic. 24.9% White.
Obama: 55.1%, Democrats: 55.4%, Democratic Party Score: 55. Lean Democratic.
3: Henry Cuellar (D). Laredo, El Paso, Big Bend, San Angelo.
73.2% Hispanic. 24.1% White.
Obama: 53.0%, Democrats: 55.3%, Democratic Party Score: 54. Lean Democratic.
4: Silvestre Reyes (D). El Paso.
77.7% Hispanic. 17.0% White.
Obama: 65.1%, Democrats: 61.4%, Democratic Party Score: 63. Safe Democratic.
5: Ruben Hinojosa (D). Harlingen, Edinburg, Weslaco.
73.5% Hispanic. 23.7% White.
Obama: 56.1%, Democrats: 57.1%, Democratic Party Score: 57. Likely Democratic.
6-9: Covered below.
10: Quico Canseco (R) (?). San Antonio, Killeen, Fort Hood.
66.4% White. 19.0% Hispanic. 9.5% African American.
Obama: 32.4%, Democrats: 30.1%, Democratic Party Score: 31. Safe Republican.
11: Randy Neugebauer (R). Lubbock, Amarillo.
61.4% White. 29.7% Hispanic.
Obama: 26.6%, Democrats: 26.7%, Democratic Party Score: 27. Safe Republican.
12: Mike Conaway (R). Midland, Odessa, Abilene, and Big Spring.
61.9% White. 30.8% Hispanic.
Obama: 24.1%, Democrats: 28.2%, Democratic Party Score: 26. Safe Republican.
13: Mac Thornberry (R). Wichita Falls, Sherman, Denison, Texarkana.
76.1% White. 11.6% Hispanic. 9.5% African American.
Obama: 27.0%, Democrats: 34.2%, Democratic Party Score: 31. Safe Republican.
14: Louie Gohmert (R) v. Ralph Hall (R). Tyler, Rockwall, Athens.
76.3% White. 11.5% Hispanic. 9.8% African American.
Obama: 28.1%, Democrats: 30.7%, Democratic Party Score: 30. Safe Republican.
15: Vacant. Orange County, Conroe.
74.5% White. 12.7% Hispanic. 10.7% African American.
Obama: 27.0%, Democrats: 34.4%, Democratic Party Score: 31. Safe Republican.
16: Bill Flores (R). Waco, Bryan-College Station.
65.6% White. 18.9% Hispanic. 11.7% African American.
Obama: 35.4%, Democrats: 37.4%, Democratic Party Score: 36. Safe Republican.
17: Covered below.
18: Ron Paul (R). Pearland, Lake Jackson, Victoria, Brenham.
59.3% White. 28.4% Hispanic. 8.9% African American.
Obama: 33.3%, Democrats: 35.9%, Democratic Party Score: 35. Safe Republican.
19: Covered below.
20: Kay Granger (R) (?). Fort Worth, Decatur, Cleburne.
80.1% White. 13.0% Hispanic.
Obama: 27.1%, Democrats: 28.1%, Democratic Party Score: 28. Safe Republican.
21-28: Covered below.
29: Vacant. Marshall, Longview, Nacogdoches, Lufkin.
68.2% White. 17.0% African American. 12.9% Hispanic.
Obama: 30.7%, Democrats: 36.7%, Democratic Party Score: 34. Safe Republican.
30-36: Covered below.
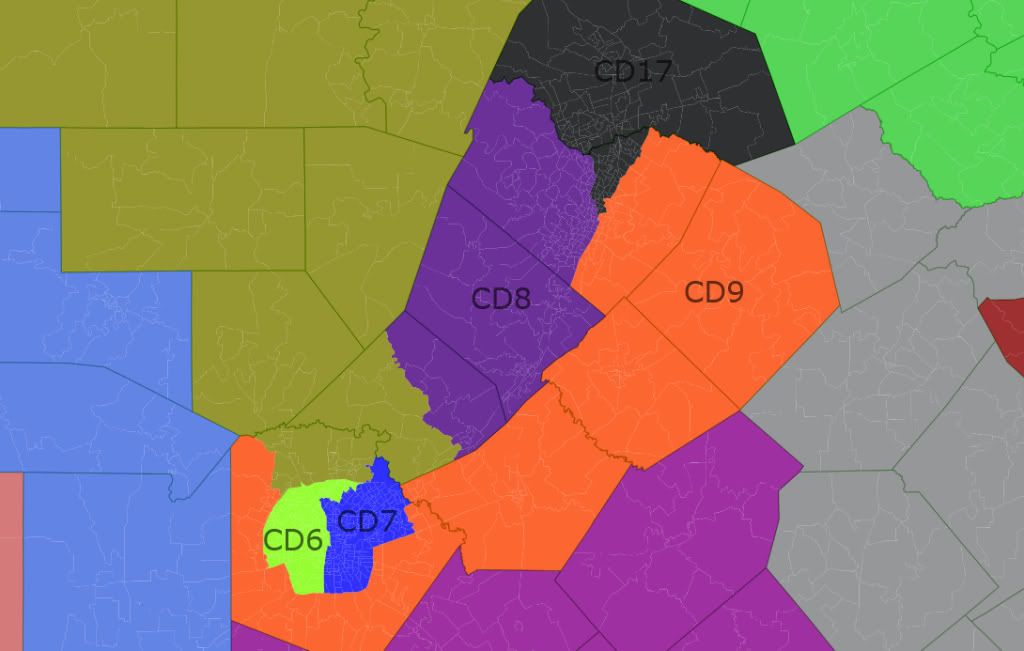
6: Vacant. San Antonio.
61.7% Hispanic. 29.0% White. 4.9% African American.
Obama: 56.4%, Democrats: 52.2%, Democratic Party Score: 54. Lean Democratic.
7: Charles Gonzalez (D) v. Lamar Smith (R). San Antonio.
54.0% Hispanic. 32.8% White. 10.0% African American.
Obama: 56.1%, Democrats: 51.6%, Democratic Party Score: 54. Lean Democratic
8: Lloyd Doggett (D) v. Michael McCaul (R). Austin, San Marcos.
70.0% White. 20.8% Hispanic. 4.9% Asian.
Obama: 54.8%, Democrats: 48.5%, Democratic Party Score: 52. Swing District.
9: Vacant. Austin, San Antonio, Seguin.
44.3% Hispanic. 41.9% White. 10.2% African American.
Obama: 54.0%, Democrats: 50.2%, Democratic Party Score: 52. Swing District.
17: John Carter (R). Round Rock, Cedar Park, Georgetown, Pflugerville.
60.2% White. 24.7% Hispanic. 7.3% African American. 6.0% Asian.
Obama: 53.2%, Democrats: 45.4%, Democratic Party Score: 49. Swing District.
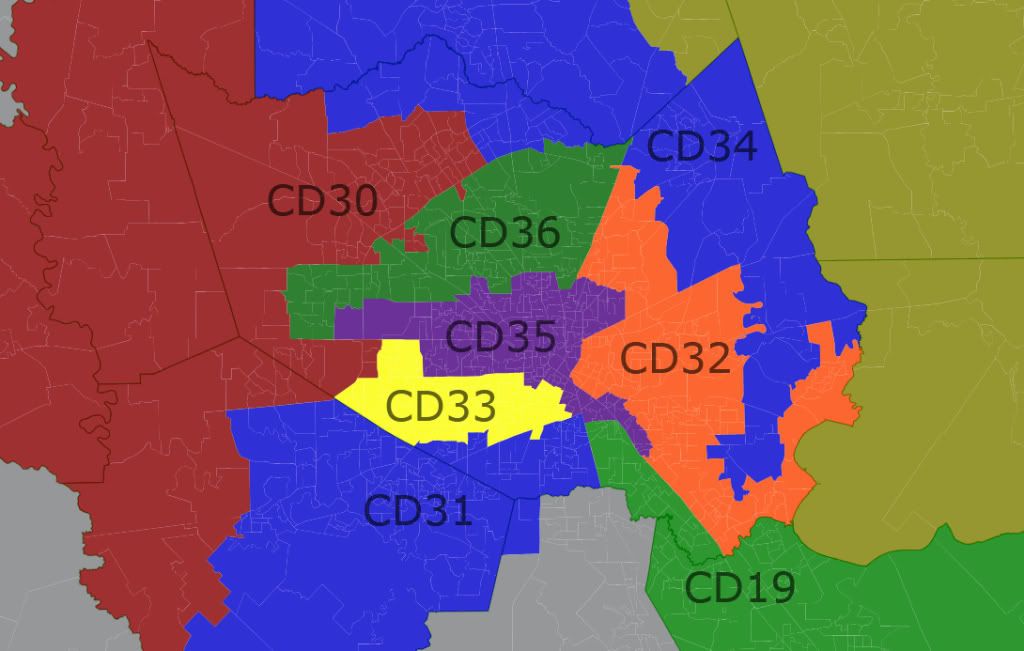
19: Vacant. Beaumont, Galveston, Houston.
50.2% White. 23.1% Hispanic. 21.0% African American. 4.4% Asian.
Obama: 46.6%, Democratic: 49.3%, Democratic Party Score: 48. Swing District.
30: Vacant. Houston, Katy.
61.0% White. 19.1% Hispanic. 9.9% African American. 8.4% Asian.
Obama: 30.5%, Democrats: 25.3%, Democratic Party Score: 28. Safe Republican.
31: Al Green (D) v. Pete Olson (R). Houston, Sugarland.
32.7% African American. 27.2% White. 24.3% Hispanic. 14.4% Asian.
Obama: 62.3%, Democrats: 57.5%, Democratic Party Score: 60. Safe Democratic.
32: Gene Green (D). Houston, Pasadena, Baytown
50.1% Hispanic. 32.3% White. 13.8% African American.
Obama: 52.2%, Democrats: 52.3%, Democratic Party Score: 52. Swing District.
33: John Culberson (R). Houston.
33% Hispanic. 30.9% White. 21% Hispanic. 13.5% Asian.
Obama: 58.5%, Democrats: 52.4%, Democratic Party Score: 55. Lean Democratic.
34: Ted Poe (R) v. Kevin Brady (R). Houston, Humble, The Woodlands.
68.7% White. 18.3% Hispanic. 8.3% African American.
Obama: 28.5%, Democrats: 25.3%, Democratic Party Score: 27. Safe Republican.
35: Sheila Jackson Lee (D). Houston.
41.4% Hispanic. 37.1% White. 16.1% African American. 4.1% Asian.
Obama: 56.6%, Democrats: 54.0%, Democratic Party Score: 55. Lean Democratic.
36: Vacant. Houston.
46.8% Hispanic. 23.5% African American. 21.6% White. 6.9% Asian.
Obama: 61.6%, Democrats: 55.3%, Democratic Party Score: 58. Safe Democratic.
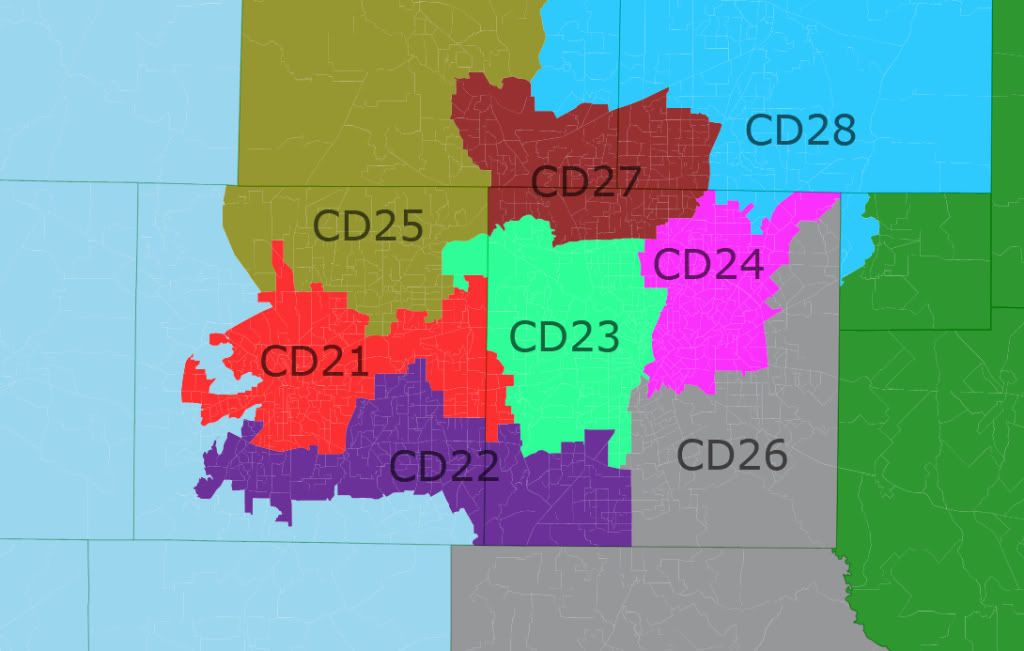
21: Vacant.
40.6% White. 36.9% Hispanic. 16.8% African American.
Obama: 56.4%, Democrats: 53.1%, Democratic Party Score: 55. Lean Democratic.
22: Vacant.
43.6% White. 29.4% African American. 19.7% Hispanic. 5.6% Asian.
Obama: 56.6%, Democrats: 50.7%, Democratic Party Score: 54. Lean Democratic.
23: Pete Sessions (R).
42.9% Hispanic. 35.7% White. 13.7% African American. 6.1% Asian.
Obama: 56.2%, Democrats: 51.2%, Democratic Party Score: 54. Lean Democratic.
24: Vacant.
42.3% White. 32.1% Hispanic. 18.3% African American. 5.8% Asian.
Obama: 55.2%, Democrats: 49.1%, Democratic Party Score: 52. Swing District.
25: Vacant.
75.8% White. 12.8% Hispanic. 5.2% African American. 4.4% Asian.
Obama: 33.0%, Democrats: 27.7%, Democratic Party Score: 30. Safe Republican.
26: Eddie Bernice Johnson (D) v. Jeb Hensarling (R) v. Joe Barton (R).
43.2% White. 27.0% African American. 26.4% Hispanic.
Obama: 54.2%, Democrats: 51.8%, Democratic Party Score: 53. Lean Democratic.
27: Kenny Marchant (R) v. Michael Burgess (R).
61% White. 17.4% Hispanic. 8.7% African American. 11.0% Asian.
Obama: 40.6%, Democrats: 31.9%, Democratic Party Score: 36. Safe Republican.
28: Sam Johnson (R).
66.9% White. 14.1% Hispanic. 8.9% Asian. 8.1% African American.
Obama: 35.6%, Democrats: 27.5%, Democratic Party Score: 32. Safe Republican.
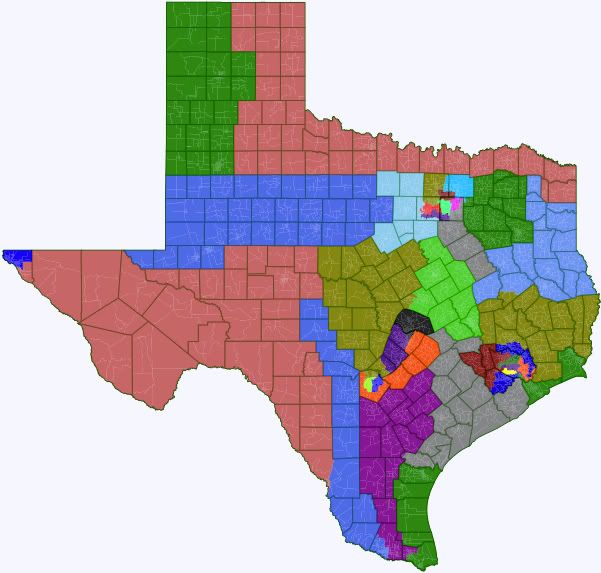 The breakdown for my complete demmymander/democratic dummymander:
Safe Republican: 15
Likely Republican: 0
Lean Republican: 0
Swing District: 6
Lean Democratic: 11
Likely Democratic: 1
Safe Democratic: 3
