NOTE: I've been scarce on writing diaries, I know. It's weird how I've been feeling about politics since Rep. Weiner essentially lied to us about those pictures, and then was forced to resign while Sen. Vitter is sitting "pretty" (sic) in his Louisiana seat despite having done patently illegal acts.
It's depressing ... both sides of it. Both the lying when he knew it would really hurt him, and the "bad guys" getting away with it. I disappeared altogether for a few days after all that.
But I digress.
The latest annual climate summary (for 2010) is out from NOAA (I see now it was put in yesterday's midday open thread as well.). A 13-slide PDF brieifing can be found here, while the full report can be found here. Summary and full report documents can be found at the latter. For those of you who are members of the American Meteorological Society (AMS), the full report will appear in the June 2011 Bulletin of the AMS (BAMS).
A couple of highlights from the report appear below the cute little squiggle.
Global Summary, 2010
Globally, the mean annual temperature was about 0.6°C (1.1°F) above the 1901-2000 mean value in 2010. This virtually tied 2010 (within the analysis error) with 2005 for warmest year in the National Climatic Data Center's records from 1880 to the present day. The graphic showing the trend over that period is below.
NCDC global mean annual temperature 1880-2010
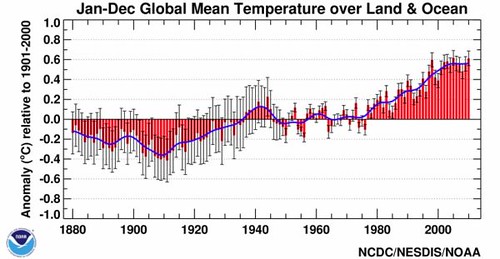
Global mean annual ocean temperatures were 0.49°C (0.88°F) above normal (3rd warmest since 1880), while global mean land temperatures were 0.96°C (1.73°F) above normal (2nd warmest since 1880). The global mean annual ocean temperature was affected by a shift from El Niño to La Niña conditions at mid-year, making the warm anomaly even more impressive. For the land temperature, the coldest winter in Europe since 1978-79 and a cold fall in Australia prevented the anomaly from breaking the record for the full period. Canada had its warmest winter and year on record. Russia suffered from an extensive heat wave and drought, plus peat and forest wild fires, that resulted in the death of thousands of people and a subsequent spike in the price of grains, especially wheat. The same atmospheric anomalies that resulted in the Russian heat wave caused flooding in Pakistan that displaced about 20,000,000 people, about 7% of their population. Flooding in Australia in the latter half of 2010 was of record proportions; this after an historic drought of a decade or more in duration. The Amazon experienced its second extreme drought in five years, resulting in extensive stress to the Amazon rain forest. There were a very large number of extremes for individual days, seasons, and annual means, more details of which can be found here.
Top Ten Global Weather/Climate Events
NOAA came out with its top ten significant global weather/climate events for 2010 as well. I've duplicated the table therein here:
| Rank |
Event |
When Occurred |
Event Description |
More Information |
| 1 |
Russian - European - Asian Heat Waves |
Summer |
A severe summer spawned drought, wildfires and crop failures across western Russia, where more than 15,000 people died. All-time high temperatures occurred in many cities and nations in the region. China faced locust swarms during July. |
NCDC Global Hazards |
| 2 |
2010 as [near] warmest year on record |
calendar year |
According to NOAA, the globally-averaged temperature for 2010 will finish among the two warmest, and likely the warmest, on record. Three months in 2010 were the warmest on record for that month. |
NCDC Global Report |
| 3 |
Pakistani Flooding |
Late July - August |
Rainfall related to the Asian Monsoon was displaced unusually westward, and more than a foot of rain fell across a large area of the Upper Indus Valley. Subsequent flooding down the Indus River killed 1,600 people and displaced millions. |
NCDC Global Hazards, NASA Imagery |
| 4 |
El Niño to La Niña Transition |
Mid-to-Late Boreal Spring |
ENSO, the most prominent and far-reaching patterns of climate variability, saw a huge swing in mid-2010. Only 1973, 1983 and 1998 have seen larger within-year swings. |
CPC, NCDC ENSO |
| 5 |
Negative Arctic Oscillation |
Early 2010 |
The AO Index, which is strongly correlated with wintertime cold air outbreaks, reached -4.27 for February, the largest negative anomaly since records began in 1950. Major cold air outbreaks occurred throughout the Northern Hemisphere. |
NCDC Cold Season Report |
| 6 |
Brazilian Drought |
Ongoing |
A severe drought parching northern Brazil shrunk the Rio Negro, one of the Amazon River's most important tributaries, to its lowest level since records began in 1902 at its confluence with the Amazon. The Amazon's depth there fell more than 12 feet below its average. |
NCDC Global Hazards |
| 7-tie |
Historically Inactive NE Pacific Hurricane Season |
May 15 - Nov 30 |
The Northeast Pacific Hurricane Season was one of the least active on record, produced the fewest named storms and hurricanes of the modern era, and had the earliest cessation of tropical activity (Sep 23) on record. |
NCDC Hurricane Summary |
| 7-tie |
Historic N. Hemispheric Snow Retreat |
January - June |
Despite December 2009 having the second-largest snow cover extent of the satellite record (mid-1960s), the melt season was ferocious, contributing to spring floods in the Northern U.S. and Canada. Following the early and pronounced snow melt, the North American, Eurasian and Hemispheric snow cover was the smallest on record for May and June 2010. |
NCDC 2010 Global Snow Report |
| 9 |
Minimum Sea Ice Extent |
mid-September |
The 2010 sea ice minimum of 4.9 million sq km was the third smallest on record. The last four years (2007-2010) are the four smallest on record. The Northwest Passage and the Northern Sea Route were simultaneously ice-free in September, a first in modern history. |
NCDC Sea Ice |
| 10 |
China Drought |
First Half of 2010 |
A persistent drought centered in the Yunan Province was touted as perhaps the worst in this region in more than 100 years. Major crop losses and lack of drinking water created severe problems for local residents. |
NCDC Global Hazards |
Receiving
honorable mention were the following events:
| Event |
When Occurred |
Event Description |
More Information |
| China Floods |
Early Aug |
Two separate heavy rainfall events in early August killed 1,500+ people across northeastern and northwestern China. Heavy rainfall continued in northeastern China (and North Korea), leading to China's worst flooding in more than a decade. |
NCDC Global Hazards |
| Large Iceberg Breaks off Petermann Glacier |
August 5 |
A piece of ice measuring approximately 250 sq km (97 sq mi, roughly four times the size of Manhattan Island) broke off of the floating ice shelf portion of the Petermann Glacier. The iceberg is the largest in the Arctic in nearly 50 years (1962). |
NCDC Global Hazards |
| Igor & Julia Simultaneous Category 4 Hurricanes |
September 15 |
Julia strengthened to a Category 4 Hurricane on Sep 15th and joined Igor, which had been Category 4 for several days, as the first Category 4 tandem observed in the Atlantic since 1926. Julia was also the easternmost Category 4 on record. |
NCDC Global Hazards, NCDC Hurricanes |
| Super Typhoon Megi |
Oct 12-24 |
Megi's central pressure of 885 mb made it the strongest tropical cyclone of 2010 and one of the strongest tropical cyclones ever recorded in any basin. It made one of the costliest landfalls in Filipino history and killed at least 69 people. |
NCDC Global Hazards, NCDC Hurricanes |
| Coral Reef Bleaching |
NH Spring -Summer |
A combination of long-term warming and the transient influence of ENSO contributed to several large bleaching events, in the Pacific's "Coral Triangle" and the southern Caribbean and tropical Atlantic |
NCDC Global Hazards |
| Cyclone Phet |
Early June |
Forming in very late May, Phet became the second-strongest Arabian Sea Cyclone on record, reaching Category 4 status. |
NCDC Global Hazards, NCDC Hurricanes |
| Bangladesh Driest Monsoon Season since 1994 |
Warm Season |
Despite late-season flooding and torrential rains, Bangladesh experienced its driest monsoon in 16 years. |
NCDC Global Hazards |
| Hurricane Celia |
Jun 19-28 |
Celia was only the second Category 5 hurricane ever recorded for the East Pacific Ocean during the month of June. |
NCDC Hurricanes |
| Summer Snow in Australia |
Jan 18 |
After experiencing 100°F+ temperatures in the region during the previous week, parts of New South Wales saw accumulating snowfall. The snow in Bombala was the first summer snow since 1965. |
NCDC Global Hazards |
| Atlantic Cyclone Xynthia |
Feb 27 |
An unusually powerful cyclone traversed western Europe bringing hurricane force winds and causing more than 60 fatalities. |
NCDC Global Hazards |
| European Cold Snap & Winter Storm |
Early Jan |
This prolonged and severe episode brought cold and snow to a wide area of Europe. 59 inches of snow fell in Leszno, Poland, leaving 150+ people dead and 200,000 without power. Many airport closures occurred across the continent. UK experienced its longest cold snap since 1981. Snow occurred in Seville, Spain for first time in 50 years. |
NCDC Global Hazards |
| South American Cold Snap |
July |
Frigid Antarctic air gripped nearly all of S. America south of 10°S. Buenos Aires had its lowest temperature in a decade, while Lima saw its coldest in 46 years. Hundreds of people and 10% of mountain alpacas succumbed to the cold. |
NCDC Global Hazards |
| Extreme Winter Weather in Europe* |
Most of December |
Cold Arctic air gripped western Europe during most of the first three weeks of December. Two major snowstorms, icy conditions, and frigid temperatures wreaked havoc across much of the region. Over the course of the period, airports in the UK, Germany, France, the Netherlands, Belgium, and Switzerland were forced to cancel or delay thousands of flights, stranding tens of thousands of passengers. Further, railways and bus services were disrupted, stranding thousands more. It was the coldest December on record in the UK since 1890. |
NCDC Global Hazards |
| Australian Flooding |
December 25 |
After experiencing its wettest spring (September -November) on record, Tropical Cyclone Tasha made landfall near Cairns in Queensland, Australia on December 25th, bringing heavy rainfall to an already waterlogged region. Widespread flooding reportedly covered an area the size of Germany and France, combined. Agricultural and mining activities were disrupted and damage estimates were about 5 billion dollars (USD).
|
NCDC Global Hazards |
* This event occurred after the top ten voting, but may have warranted top ten placement.
Arctic Sea Ice in 2010
Something I cover quite a bit here. Below is the time series and linear trend lines for monthly mean March and September sea ice extent from 1979 to 2010 (the length of the satellite record), with areal extent in km2. March and September are used here to show trends in maximum and minimum sea ice extent values.
March and September Arctic Sea Ice Extent, 1979-2010

There are three important trends in this time series. Two of them are obvious; both the monthly mean March and September Arctic sea ice have been decreasing; the September value much more rapidly than the March value. The third trend is less obvious; cold season ice formation has not been quite enough to get to full areal extent recovery on a long-term basis. And even if it were, sea ice has been thinning since the start of the satellite record, as shown by the
PIOMAS sea ice model at the University of Washington.
U of WA PIOMAS Arctic Sea Ice Volume, 1979-May 31,2011

The daily volume anomalies are shown with a gray line with error bars for each year indicating the uncertainty in the monthly anomaly for that year. The linear trend for the sea ice volume anomaly is shown in bold blue line, and the ±1 and 2 standard deviation from the anomaly trend in dark and light gray shading, respectively. While we cannot state this unequivocally, it appears that the anomaly trend is beginning to exhibit an acceleration in volume loss, perhaps starting as far back as 2002.
The volume of ice (height x width x depth) indicates the mass of ice that remains; the lower the volume, the less heat it will take to remove all that ice completely. The next graphic shows the actual volume of sea ice remaining.
U of WA PIOMAS Arctic Sea Ice Volume, Mean Annual Cycle, 2007, and 2011 to 31 May

The black line with black circles shows the mean seasonal cycle of Arctic sea ice volume over the full satellite period from 1979-2010. The dark and light gray bands are again ±1 and 2 standard deviations from the mean seasonal cycle. The record Arctic sea ice year of 2007 is plotted with a grey line with crosses for the mean values for each month. The current year 2011 is plotted with blue line and blue triangles for monthly mean values each month. Note that even though we started with about the same amount of ice at the beginning of 2011 as in 2007, there was about 10% less volume. The value in May 2011 was 28% below the mean seasonal cycle, and about 10% or so less than 2007.
Of course, the thinner the ice, the less stable it is.
El Niño-Southern Oscillation (ENSO) in 2010
A primer on ENSO: because of general circulation driven by the distribution of solar heating across the globe and the earth's rotation, the eastern equatorial Pacific Ocean is marked by strong easterly trade winds at the surface and upwelling cool ocean water from below as surface waters spread out away from the equator. This results in the eastern equatorial Pacific cold tongue, stable atmospheric conditions, and the coastal deserts from southern Ecuador to northern Chile. The water is warmed by the sun as it piles up in the western Pacific, in a warm pool surrounding the islands between southeast Asia and Australia. As one might expect, sea level height slopes lower from west to east in response to the prevailing winds.
La Niña (a.k.a. cold ENSO event) is just an accentuation of the normal seasonal cycle, with colder than normal eastern Pacific sea surface temperatures, stronger than normal easterly trade winds, and warmer than normal SSTs in the western Pacific warm pool. El Niño occurs when the trades weaken or even reverse direction, allowing the sea level slope to relax, and the warm water then sloshes eastward through the Pacific. This is known as a warm ENSO event.
The El Niño warm event that brought record precipitation to areas of North America during the 2009-2010 winter season came to an abnormally abrupt end during the summer of 2010, and switching rapidly to La Niña. This makes the high global mean temperature for 2010 all the more impressive. La Niña years typically feature cooling. In June 2011, the La Niña ended; we are now in a neutral phase of ENSO. The associated general circulation departures from normal have been winding down and should reflect neutral ENSO conditions by the end of the summer season.
Postscript: Current Arctic Conditions
Arctic sea ice extent has taken a dive the last 3 days, decreasing almost 400,000 km2 in that time. Graphics below are from the International Arctic Research Center (IARC) and the National Snow and Ice Data Center (NSIDC) from top to bottom.
IARC Arctic Sea Ice Extent, Annual Cycle from 2002 through 2010, through 3 July for 2011

National Snow and Ice Data Center Arctic Sea Ice Extent, 1 Mar - 31 Jul mean and 95% confidence level, 1 Mar - 31 July 2007 (dash, record minimum year), 1 Mar - 3 July 2011 (solid blue)

The value from the IARC is the second lowest of the 2002-2011 record for 3 July, and slightly below the record minimum from last year. The NSIDC shows the current year value slightly below the 2007 value, in relative agreement with the IARC data.
Last year, extent decrease slowed after early July as winds and temperature were relatively unfavorable for melting. What will happen this year? Stay tuned.
