The Texas State Legislature released a Republican gerrymander plan in April (found here that was immediately critized in the liberal blogosphere for being in violation of the Voting Rights Act, unfair and ridiculously shaped, cracking Austin in something like five districts.
I want to present here how a plan could look that could have been drawn by a nominally independent, but basically partisan Republican commission that follows these guidelines:
*I'm not looking at incumbent's residences or the current districts.
*I'm drawing more VRA seats than the current map does.
*I generally try to avoid cracking cities that could be kept within one Congressional District.
*No completely ugly, NC-12 style lines
* I reject Fajita stripping. Come on, there are like two million Hispanics in South Texas with a density of 90+% Hispanics in basically every precinct. It's ridiculous to split that community in a billion parts just to avoid "packing" Hispanics. That's shameful if it's done intentionally, but if you'd have to draw a map that looks like a LSD-painting to avoid it, then you should just draw a district with Hispanic percentage in the high 80s.
*More on a meta-level I also want to use this diary to present how much you can actually read out of the Dave's Redistricting App files automatically if you know your way with Excel. Nothing here, except for the commentary of course, was calculated manually or even specifically for this state.
For each district you will find some demographic and political information-- by the way, if it always looks the same to you in terms of format, that's because I'm automatically generating it. This is an example:
30.6% Obama, 69.4% McCain, 33.9% Democratic average performance, 66.1% GOP Average Performance, 67.7% White Voting Age Population, 17.4% Black VAP, 12.8% Hispanic VAP.
I will also show from which old districts the new territory of a given district comes-- as a percentage of population. For example, 92.7% of the new First District's territory come from the old First District (Louie Gohmert), while 7.3% are contributed by Jeb Hensarling's old 5th district.
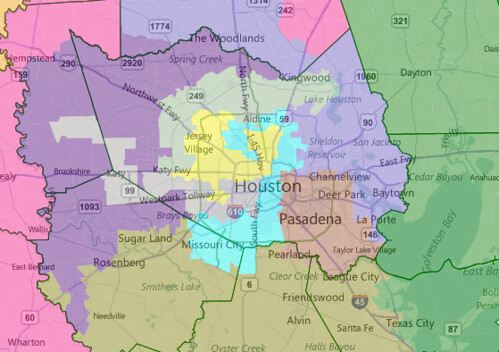
Let's start with a statewide and a couple of metro-area maps:


Now, for the single Congressional Districts:
CD-01

As I already mentioned, CD-01 is largely unchanged.
30.6% Obama, 69.4% McCain, 33.9% Democratic average performance, 66.1% GOP Average Performance, 67.7% White Voting Age Population, 17.4% Black VAP, 12.8% Hispanic VAP.
Gohmert: 92.7% Hensarling: 7.3%
Safe R for Gohmert.
CD-02

38.4% Obama, 61.6% McCain, 46.5% Democratic average performance, 53.5% GOP Average Performance, 64.7% White Voting Age Population, 18.9% Black VAP, 13.2% Hispanic VAP.
Poe: 44% Brady: 39.2% Paul: 16.6% Olson: 0.3%
Poe and Brady would have to sort out who runs who, but I think Poe gets this district as Brady has a better district to run here-- this district has a Democratic ancestral history and even relatively recently, Democrats didn't get destroyed here. Still, this district is trending R and for an incumbent like Poe it should be absolutely safe.
Safe R
CD-03

37.4% Obama, 62.6% McCain, 28.5% Democratic average performance, 71.5% GOP Average Performance, 65.2% White Voting Age Population, 8% Black VAP, 12.9% Hispanic VAP.
Samuel Johnson: 75.2% Hall: 24.8%
Samuel Johnson's seat sheds Garland and adds more of Collin County-- a trade he should be very happy with as his district gets 5% more Republican.
Safe R
CD-04

29.5% Obama, 70.5% McCain, 37.1% Democratic average performance, 62.9% GOP Average Performance, 77.6% White Voting Age Population, 10.6% Black VAP, 9.2% Hispanic VAP.
Hall: 84.3% Gohmert: 9.7% Hensarling: 6%
Democrat-turned-Republican Ralph Hall keeps his seat largely unchanged, it's just used to shore up Johnson a bit. Not even Sam Rayburn could win this seat if he came back from the dead and was still a Democrat.
Safe R
CD-05

44.3% Obama, 55.7% McCain, 42.4% Democratic average performance, 57.6% GOP Average Performance, 57.5% White Voting Age Population, 14.7% Black VAP, 23.9% Hispanic VAP.
Hensarling: 72.7% Bernice Johnson: 16.1% Sessions: 8.4% Samuel Johnson: 2.9%
Hensarling's seat is one of the weaker ones on this map for the GOP, as it loses conservative rural territory and picks up parts of Dallas. For now it is safely Republican, by the Congressional Elections of 2020 it might start slipping away from the Republicans. The advantage of adding Dallas territory is, however, that the district is unlikely to nominate the kind of Democrat needed to win here.
Safe R
CD-06

The shape of the ugly 6th is largely VRA-nessecitated.
39% Obama, 61% McCain, 36.1% Democratic average performance, 63.9% GOP Average Performance, 60.4% White Voting Age Population, 10.5% Black VAP, 22.8% Hispanic VAP.
Barton: 43.5% Granger: 41% Marchant: 10.2% Burgess: 5.3%
Neither Barton nor Granger have an obviously better seat to run in, so potentially we could see a GOP primary here, Arlington vs. Ft. Worth- Parker Cnty.
Even though Barton has a few more constituents in here, Granger has some more McCain-voting constituents in this district-- the more important metric in a GOP primary. This favors Granger by 5,000 voters (65.4-60.4 thousand). The balance is held by Marchant's Republican constituents (10,000, geographically closer to Barton) and Burgess' (8,000, geographically in between the two).
Barton should be favored because of ideology, seniority and district numbering, but still, this is a relatively even fight geographically.
Safe R
CD-07

Don't ask me why Texas' districts are numbered the way they are, but I tried to number them the same way as in the old map as much as possible. However, we're taking a jump from Ft Worth to Houston now for this district.
46.4% Obama, 53.6% McCain, 40.2% Democratic average performance, 59.8% GOP Average Performance, 49.1% White Voting Age Population, 12.3% Black VAP, 24.8% Hispanic VAP.
Culberson: 43.6% Al Green: 33.8% Paul: 11.1% McCaul: 9.4% Jackson-Lee: 2.1%
Right now, this district still favors Republicans, but it's trending Democratic and Culberson isn't the strongest incumbent. I wonder if he'd not be better off running elsewhere. I expect this district to continue to elect Republicans for the better part of the decade, but towards the end of it, Democrats could have a shot. Culberson would have had a narrow election under these lines in 2008, winning just by mid-single digits against well-funded Democratic challenger Michael Skelly, but that was a Dem wave year.
Likely to Safe R now, Lean to Likely R later.
CD-08

32.7% Obama, 67.3% McCain, 30.6% Democratic average performance, 69.4% GOP Average Performance, 60% White Voting Age Population, 10.8% Black VAP, 25.5% Hispanic VAP.
Brady: 47.7% Poe: 26.5% Raymond Green: 20.9% Olson: 3.2% McCaul: 1%
Brady would certainly leave Poe the 2nd district to run in, as this district is much safer and more comfortable for him.
Safe R
CD-09

83.7% Obama, 16.3% McCain, 80.9% Democratic average performance, 19.1% GOP Average Performance, 13% White Voting Age Population, 50.5% Black VAP, 29.5% Hispanic VAP.
Jackson-Lee: 39.9% Al Green: 36.1% Olson: 15.4% Raymond Green: 8.6%
An African-American VRA district in Houston. This is what Republicans get for leaving the 7th (and as you'll see in a few minutes, the 18th) slightly vulnerable to strong Democratic candidates in strong Democratic years: Eliminating one of Al Green or Sheila Jackson-Lee. I personally root for Green, but whatever.
Jackson-Lee has a slight edge in Obama voters (81,000-74,000), but that difference is swamped by the 30,000 Obama voters who immigrate from Olson's and Raymond Green's districts.
I wonder why the GOP didn't go for this in 2003. This district isn't uglier than some existing VRA districts, such as NC-01.
Safe D
CD-10

38.1% Obama, 61.9% McCain, 38.8% Democratic average performance, 61.2% GOP Average Performance, 61.8% White Voting Age Population, 10.9% Black VAP, 23.6% Hispanic VAP.
McCaul: 30.3% Brady: 28.5% Doggett: 21.4% Paul: 13.2% Flores: 3.8%
Brady has a better seat to run in. McCaul-- well, there's a district in which he already represents over 50%, but that district is 4 or 5 points worse for the Republicans. My guess is he'd still prefer to run there, but who knows.
Safe R
CD-11

36% Obama, 64% McCain, 36.8% Democratic average performance, 63.2% GOP Average Performance, 40.3% White Voting Age Population, 3.3% Black VAP, 54.6% Hispanic VAP.
Conaway: 60.9% Canseco: 29.8% Reyes: 9.3%
Since Reyes' district is shrinking (in terms of area, obviously, not population, the population is growing), Conaway picks up some territory formerly represented by Reyes.
He's still safe in this VRA Hispanic district-- not even narrowly, this district has a 54.6% Hispanic VAP population, and 59.4% adult population. Certainly no base for a lawsuit.
Safe R
CD-12

I REALLY don't get the numbering here, but whatever.
34.2% Obama, 65.8% McCain, 28.6% Democratic average performance, 71.4% GOP Average Performance, 69.5% White Voting Age Population, 5.8% Black VAP, 15% Hispanic VAP.
Granger: 38.9% Marchant: 36.6% Burgess: 19.3% Sessions: 5.2%
In case Granger wants to forgo the matchup against Barton, here's her other shot. She really is unlucky in being basically eliminating between two higher-profile Republicans.
She would probably have a better shot against Barton than against Marchant though, because while she represents more constituents here than Marchant does, Marchant's voters are loyal Republicans, and have an insanely high turnout (they're almost all white, that helps) and Granger's are much less reliable: Granger's constituents here voted 54,000-29,000 for McCain, Marchant's 73,000-39,000.
Burgess contributes 40,000 McCain voters here, which are demographically more like Marchant's people than like Granger's. Sessions contributes relatively insignificant 8,000 McCain voters (and 6,000 Obama voters).
My hunch is that Granger would lose against either Barton or Marchant, but by a higher margin here.
Safe R
CD-13

23.6% Obama, 76.4% McCain, 29.3% Democratic average performance, 70.7% GOP Average Performance, 69.9% White Voting Age Population, 5.6% Black VAP, 21.8% Hispanic VAP.
Thornberry: 45.4% Neugebauer: 39.2% Conaway: 15.4%
Unfortunately, no juicy primary here-- Neugebauer has a much better seat to run in than this one, so he'll leave it to Thornberry.
Safe R
CD-14

36.7% Obama, 63.3% McCain, 36.2% Democratic average performance, 63.8% GOP Average Performance, 56.3% White Voting Age Population, 11.7% Black VAP, 22% Hispanic VAP.
Olson: 50.3% Paul: 49.7%
The marquee matchup of the cycle! Olson is forced in a primary against either Paul or Raymond Green, and my guess is he'd rather take a shot at the unconventional Paul than against the basically Generic Republican (just like Olson) Green.
If Paul doesn't retire faced with that, he'd be sure to be the best-funded Congressional Primary candidate ever, though.
Paul has 80,000 McCain voters here, Olson 74,000. No other incumbents represent any part of this district, this is just a one vs. one cage match.
Safe R
CD-15

68.7% Obama, 31.3% McCain, 66.3% Democratic average performance, 33.7% GOP Average Performance, 10.6% White Voting Age Population, 0.3% Black VAP, 87.7% Hispanic VAP.
Hinojosa: 63.3% Cuellar: 36.7%
I'm sure this will be the basis of a lawsuit, but come on. This district is surrounded by territory that is just as Hispanic, if not more so. Unless you draw the seat up to San Antonio, which is just ridiculous, it will just be that Hispanic. Bush Democrat Cuellar would, of course, be dumb to challenge Hinojosa here and I'm sure he'll not do it. HIs other options are running in a 55-45 McCain district or challenging Blake Farenthold in a D district in which he represents just over 10%... if I were him, I'd go for the last option with Hinojosa's and the DCCC's backing in the primary.
Safe D
CD-16

65.7% Obama, 34.3% McCain, 62.2% Democratic average performance, 37.8% GOP Average Performance, 16.6% White Voting Age Population, 3% Black VAP, 78.1% Hispanic VAP.
Reyes: 100%
Seriously. Reyes' district saw so much growth that it simply contracted and still had 65.000 people left to give to Conaway. Given the fact that these 65,000 people just managed to produce 10,000 votes in 2008, Conaway won't get a major headache from that, even with those 10,000 votes breaking 75-25 Obama. Obviously Hispanic VRA.
CD-17

39.6% Obama, 60.4% McCain, 38.3% Democratic average performance, 61.7% GOP Average Performance, 62.4% White Voting Age Population, 10.9% Black VAP, 23.2% Hispanic VAP.
Granger: 30.3% Flores: 30.1% Barton: 27% Burgess: 11.9% Marchant: 0.7%
This would be the last opportunity for poor Kay Granger to run in, and it might just be the best. Flores, Barton, Burgess and Marchant all have better shots to run it, but as a relatively moderate (by TX standards) Republican she'd certainly still face a primary in this district.
Safe R
CD-18

48.7% Obama, 51.3% McCain, 45.7% Democratic average performance, 54.3% GOP Average Performance, 32.9% White Voting Age Population, 9.4% Black VAP, 50.6% Hispanic VAP.
Jackson-Lee: 38.1% Culberson: 30.8% Raymond Green: 19.8% Al Green: 10.7% McCaul: 0.7%
I think this district looks worse for Republicans than it is. In midterms it should still be strongly Republican-- take this for instance: A Precinct with 10,000 people in it, 84% Hispanic, produced 419 votes for Obama and 419 for McCain. Another example: Jackson-Lee's part of the district has much more people than Culberson's. However, Culberson's part produced 77,000 votes in 2008, Jackson-Lee's just 67,000 votes-- and 27,000 of those were McCain votes.
The turnout in the Democratic parts of this seat is just ridiculous, and right now the smart bet here is on the Republicans. In the second half of the decade, that may change.
This would almost certainly be an open seat, as Jackson-Lee and Culberson wouldn't run here, nor would, of course, the Greens. This is a Hispanic VRA seat-- yeah, just narrowly, but you can't do much better here after having drawn the black VRA seat.
Likely R now--Toss-Up towards the end of the decade.
TX-19

26.9% Obama, 73.1% McCain, 27% Democratic average performance, 73% GOP Average Performance, 61.2% White Voting Age Population, 5.6% Black VAP, 30% Hispanic VAP.
Neugebauer: 60.7% Thornberry: 39.3%
Super-Safe for Neugebauer. And the fact that a 61.2% White VAP seat (56.1% total) can be 73% McCain shows that reaching majority-minority status even among adults will not suddenly catapult the Democrats into contention here or statewide.
Safe R
TX-20

50% Obama, 50% McCain, 44.2% Democratic average performance, 55.8% GOP Average Performance, 40.1% White Voting Age Population, 4.9% Black VAP, 50.1% Hispanic VAP.
Gonzales: 48.7% Canseco: 27.4% Smith: 23.9%
Another Hispanic VRA seat, carried by Obama by 84 votes. You could argue that this is just nominally a VRA seat and doesn't allow Hispanics to elect their candidate of choice, but given the fact that currently 76% of the district are represented by Hispanic Congressmen, that argument seems unlikely to succeed.
Smith and Gonzales both have better districts to run in, Canseco doesn't. The district is about 2 points improved for Canseco compared to his current 23rd, and he's favored to hold on to it for now. Even later in the decade, his Hispanic ancestry should help him to keep the seat in the GOP column as it trends Democratic due to Hispanic population growth. A generic 56-44 GOP advantage is also nothing to sneeze at.
Lean to Likely R now, Toss-Up later in the decade, Lean D if Canseco retires after, say, 2016.
TX-21

38.7% Obama, 61.3% McCain, 33.5% Democratic average performance, 66.5% GOP Average Performance, 58.8% White Voting Age Population, 6.4% Black VAP, 30.8% Hispanic VAP.
Smith: 49.8% Doggett: 19.9% Cuellar: 19.6% Canseco: 6.3% Gonzales: 4.4%
Smith would both run and easily win here.
Safe R.
TX-22

44% Obama, 56% McCain, 43.9% Democratic average performance, 56.1% GOP Average Performance, 35.2% White Voting Age Population, 7.5% Black VAP, 51.4% Hispanic VAP.
Olson: 50.8% Raymond Green: 45.3% Al Green: 2.7% Jackson-Lee: 0.7% Paul: 0.5%
Hispanic VRA, but pretty solidly Republican for now, even though Democrats might be able to make a play here just in time for the next redistricting.
I think Olson would probably prefer to run against Paul and not Raymond Green, so Green would get the GOP nod here.
Safe R now, Likely R later.
TX-23

66% Obama, 34% McCain, 65% Democratic average performance, 35% GOP Average Performance, 19% White Voting Age Population, 8.1% Black VAP, 70.5% Hispanic VAP.
Gonzales: 48% Canseco: 43.1% Smith: 7.9% Cuellar: 1%
A safe seat for Charlie Gonzales, solidly Hispanic VAP.
Safe D
TX-24

And suddenly we jump back from San Antonio to Houston. Seriously, WTF, Texas?
42.1% Obama, 57.9% McCain, 36% Democratic average performance, 64% GOP Average Performance, 43.6% White Voting Age Population, 16.6% Black VAP, 27.6% Hispanic VAP.
McCaul: 51.2% Al Green: 22.1% Poe: 10.7% Olson: 10.5% Culberson: 2%
McCaul should have a reasonably easy time here through 2020.
TX-25

70.9% Obama, 29.1% McCain, 64.2% Democratic average performance, 35.8% GOP Average Performance, 52.3% White Voting Age Population, 8% Black VAP, 32.5% Hispanic VAP.
Doggett: 55.7% McCaul: 30.2% Smith: 14.1%
Look, there! Austin isn't split and the world is still spinning around! Doggett survives here and doesn't have to fear a primary either.
Safe D
TX-26

38.1% Obama, 61.9% McCain, 30.7% Democratic average performance, 69.3% GOP Average Performance, 67.3% White Voting Age Population, 8.5% Black VAP, 15.6% Hispanic VAP.
Burgess: 74.9% Marchant: 19.9% Samuel Johnson: 5.3%
Move on, nothing to see here. Burgess is the only Dallas-metro Congressman who doesn't have to worry about a primary in this map.
TX-27

61.6% Obama, 38.4% McCain, 60.5% Democratic average performance, 39.5% GOP Average Performance, 17.9% White Voting Age Population, 0.9% Black VAP, 79.7% Hispanic VAP.
Farenthold: 62.5% Hinojosa: 24.9% Cuellar: 12.6%
Not a seat Farenthold can win. Henry Cuellar would be a formidable candidate, though Democrats might prefer to recruit someone progressive and throw Cuellar to the wolves- the more likely scenario, I'd think.
Note how an 80% Hispanic district is just D+8 here. NOT packing Hispanics here would result in a competitive seat.
Safe D
TX-28

45.9% Obama, 54.1% McCain, 44.1% Democratic average performance, 55.9% GOP Average Performance, 44.9% White Voting Age Population, 0.8% Black VAP, 51.7% Hispanic VAP.
Cuellar: 36.7% Smith: 28.1% Canseco: 13.5% Doggett: 13.1% Hinojosa: 4.5%
Cuellar could try to run here, I suppose, but he's pretty much toast. Hispanic VRA for a new GOPer, since Smith has something better than this. Cuellar got 56% in a 56% Obama seat in 2010, so it's not like he's the God of Republican Crossover despite his love for Bush.
Safe R now, Likely R later.
TX-29

41.4% Obama, 58.6% McCain, 35.1% Democratic average performance, 64.9% GOP Average Performance, 43.3% White Voting Age Population, 18.6% Black VAP, 29% Hispanic VAP.
Culberson: 33.6% Poe: 31.3% Jackson-Lee: 22.1% McCaul: 9.8% Raymond Green: 3.2%
Now this is finally the seat where Culberson can run without having to worry about trends later in this decade. Poe has his own seat, so he's solid in the primary.
Safe R
TX-30

76.8% Obama, 23.2% McCain, 71.8% Democratic average performance, 28.2% GOP Average Performance, 22.5% White Voting Age Population, 50.3% Black VAP, 22.7% Hispanic VAP.
Maybe a contender for weakest Democratic Urban African-American VRA seat?
Whatever, D+24 is still plenty safe for Eddie Bernice Johnson.
Bernice Johnson: 50.3% Marchant: 17.3% Barton: 15.4% Burgess: 14.9% Sessions: 2.1%
TX-31

40.8% Obama, 59.2% McCain, 40.9% Democratic average performance, 59.1% GOP Average Performance, 60.2% White Voting Age Population, 16.8% Black VAP, 18.4% Hispanic VAP.
Carter: 62% Flores: 36.4% Barton: 1.6%
Just like Austin gets its own seat, so does Waco, but this is a Republican seat. Carter can dictate whether he wants to run here or in TX-36, Flores gets whatever Carter doesn't want.
TX-32

59.2% Obama, 40.8% McCain, 55.1% Democratic average performance, 44.9% GOP Average Performance, 28.9% White Voting Age Population, 10.7% Black VAP, 54.7% Hispanic VAP.
Not so great for the GOP, but this is a VRA seat that has to be drawn, wrapping itself around Eddie Bernice Johnson's Black VRA seat.
Sessions: 39% Bernice Johnson: 31.4% Marchant: 29.6%
Nah, not really a seat for Sessions. Some Hispanic Democrat will win this over a Republican sacrifical lamb.
TX-33

42.9% Obama, 57.1% McCain, 45.9% Democratic average performance, 54.1% GOP Average Performance, 41.5% White Voting Age Population, 4% Black VAP, 52.5% Hispanic VAP.
Farenthold: 43.3% Paul: 18.8% Hinojosa: 17.4% Cuellar: 15.1% Doggett: 5.3%
The new seat for Farenthold if he can keep a primary challenger away. Hispanic VRA, but safe R, at least for the next 7-8 years.
Safe R now, Likely R later.
TX-34

42.2% Obama, 57.8% McCain, 36% Democratic average performance, 64% GOP Average Performance, 57.3% White Voting Age Population, 11.8% Black VAP, 22.3% Hispanic VAP.
Sessions: 38% Samuel Johnson: 36.5% Hall: 11.5% Hensarling: 10.7% Bernice Johnson: 3.1%
MUCH better for Sessions, especially since Johnson has a seat to run in.
Safe R
TX-35

25.9% Obama, 74.1% McCain, 31.6% Democratic average performance, 68.4% GOP Average Performance, 75.7% White Voting Age Population, 7.3% Black VAP, 15.2% Hispanic VAP.
Barton: 27.7% Conaway: 21.3% Thornberry: 11.3% Flores: 9.9% Granger: 8.5%
This will feature a very interesting GOP primary in a district with no incumbent running.
Also contributing territory: Hensarling (8%), Carter (6%), Burgess (4%), Brady (2%), Gohmert (1%)
Safe R
TX-36

40.4% Obama, 59.6% McCain, 34.8% Democratic average performance, 65.2% GOP Average Performance, 66.8% White Voting Age Population, 7.6% Black VAP, 19.4% Hispanic VAP.
Carter: 60.5% Flores: 28.4% McCaul: 11%
As mentioned above, if Carter wants this seat, he gets it, if he prefers TX-31, Flores gets this one.
Safe R
Summary
Out of 36 districts, there are:
8 safe Democratic seats.
2 Lean Republican seats.
2 Likely Republican seats.
24 Safe Republican seats.
10 Hispanic VAP majority seats.
2 Black VAP majority seats.
3 White Plurality Majority-Minority seats
21 White Majority seats
19 White Majority seats by Overall Population.
If the primaries and shuffling of seats work like I imagine, three incumbents get thrown under the bus: Paul (R), Jackson-Lee (D), Cuellar (D). The map would produce 7 new Congressmen, most likely 5 Republicans and two Democrats, even though it's possible that the split is 4-3 or worst case for the GOP 3-4.
This means that the new seats are effectively split 4-0 for the GOP, with a chance at 3-1 or very unlikely 2-2.
