This is part of a proposaloutlining one possible way to redistrict California.
This post will concentrate on Los Angeles.
More below.
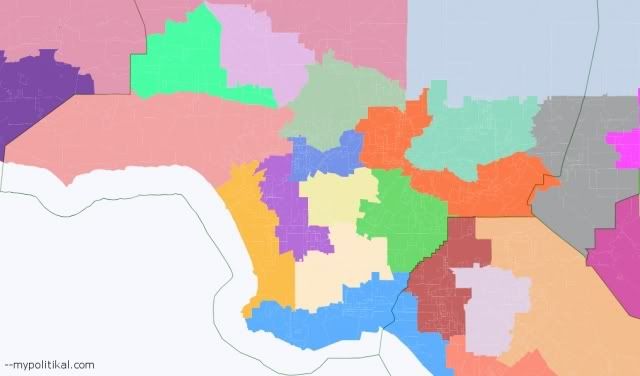
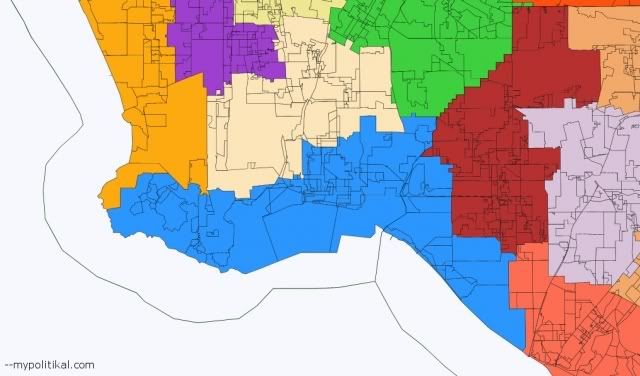
There are several parts to Los Angeles: the San Fernando Valley, the San Gabriel Valley, metro Los Angeles, and the Long Beach area.
.
Hollywood and the San Fernando Valley
The San Fernando Valley has enough population for two congressional districts, while the Hollywood area provides an additional district.
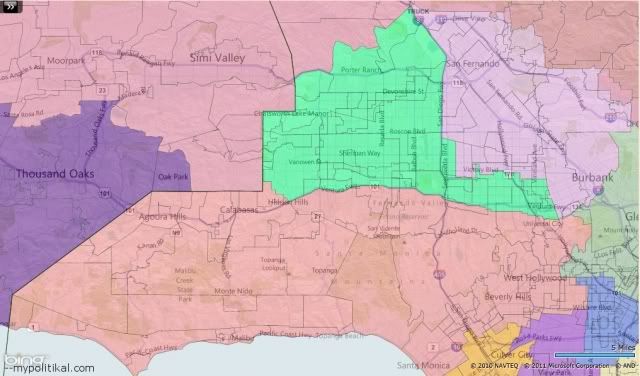
CA-27 (Spring Green):
Population â 45.0% white, 4.6% black, 34.3% Hispanic, 12.9% Asian, 0.2% Native American, 3.1% other
Majority-Minority District
This district takes in the western half of the San Fernando Valley. It stretches an awkward arm eastwards, mainly to take in some very white areas. This boosts the Hispanic percentage of the next congressional district:
CA-28 (Plum):
Population â 22.9% white, 3.0% black, 64.4% Hispanic, 7.9% Asian, 0.2% Native American, 1.7% other
Over-18 Population - 26.5% white, 59.8% Hispanic
Majority-Minority District; Majority-Hispanic
In one of the more shameful episodes of the 2000 gerrymander, the San Fernando Valley split the Hispanic population in two in order to re-elect the two white congressmen representing the region. This district bumps the Hispanic population to 64%, taking in the eastern portion of the San Fernando Valley. Redistricting with more detailed data could further strengthen the Hispanic percentage.
CA-30 (Light Coral):
Population â 73.7% white, 3.0% black, 9.2% Hispanic, 10.2% Asian, 0.1% Native American, 3.8% other
CA-30 is the Hollywood district, taking in such landmarks as Santa Monica, University City, and Beverly Hills. Demographically, the district is extremely white and mostly wealthy (one of the whitest and wealthiest districts, in fact, in all Southern California). The Hispanic population doesn't break double-digits, which is quite shocking when one looks at the rest of the districts in this post. Despite the association of Los Angeles with Hollywood, the district is actually quite unrepresentative in terms of the people who live there.
.
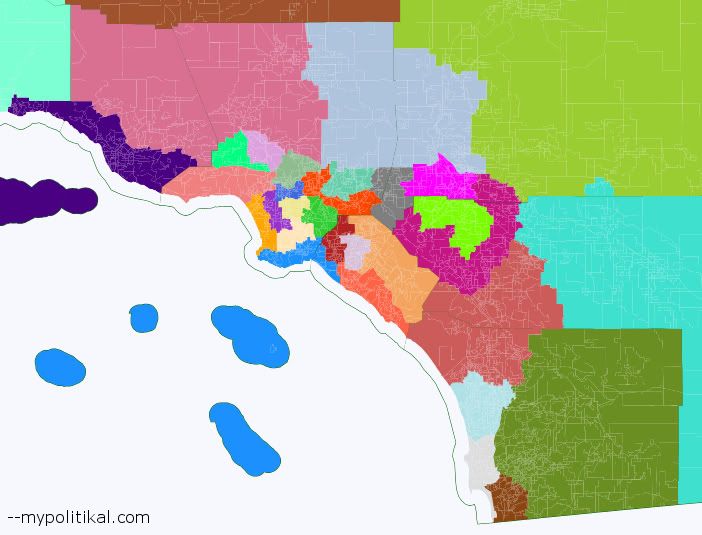
San Gabriel Valley
The San Gabriel Valley is home to three districts and parts of several others.
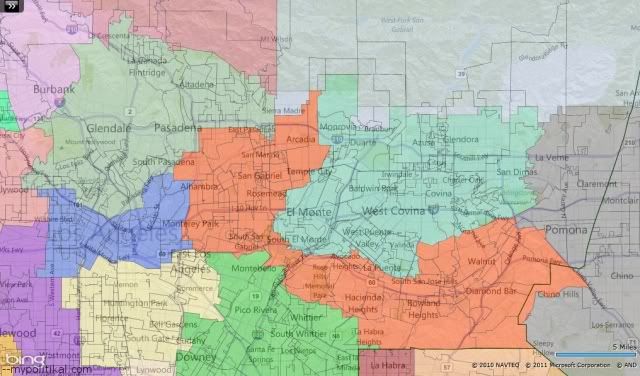
CA-29 (Dark Sea Green/Grayish, located at the top left corner of the map):
Population â 42.0% white, 4.8% black, 35.1% Hispanic, 15.1% Asian, 0.2% Native American, 2.9% other
Majority-Minority District
This district is essentially composed of relatively wealthy suburbs - Glendale and Pasadena - in the less built-up areas of Los Angeles. If Los Angeles can be compared to a giant toilet, than CA-29 would be the somewhat dirty but still relatively clean toilet seat.
CA-32 (Orange Red):
Population â 17.6% white, 2.0% black, 28.4% Hispanic, 50.0% Asian, 0.1% Native American, 1.9% other
Over-18 Population - 25.9% Hispanic, 51.3% Asian
Majority-Minority District; New Majority-Asian
CA-32 is a district drawn to be the only Asian-majority district in Los Angeles. It does this by connecting the communities around Monterey Park to those around Diamond Valley, both of which have little in common with each other. The connecting region between the two areas is geographically large but actually has very little population.
CA-38 (Medium Aquamarine, located at the center right of the map):
Population â 19.0% white, 2.3% black, 63.0% Hispanic, 14.1% Asian, 0.2% Native American, 1.4% other
Over-18 Population - 22.1% white, 58.2% Hispanic
Majority-Minority District; Majority-Hispanic
The eastern suburbs of the San Gabriel Valley, which tend to be more Hispanic, are grouped together in this district. This is an easy district to draw, as the communities of interest are both obvious and create a VRA district in a very compact manner.
.
Metro Los Angeles
Metro Los Angeles covers five congressional districts, four of which will be discussed here (the other will be discussed in the Long Beach section). Another district is located along the west shore.
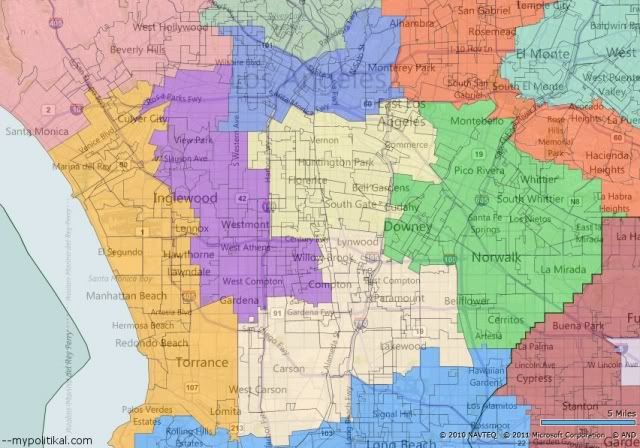
CA-31 (Khaki):
Population â 1.6% white, 9.5% black, 87.9% Hispanic, 0.5% Asian, 0.1% Native American, 1.5% other
Majority-Minority District; Majority-Hispanic
This district composes part of South-Central Los Angeles, which used to be primarily black but now has become mostly Hispanic. It is incredibly Hispanic, enough so as to make one uncomfortable; it is quite conceivable that somebody will accuse this of packing Hispanics. A discussion about this problem will be discussed further at the end of this post.
CA-33 (Royal Blue):
Population â 7.3% white, 6.7% black, 67.8% Hispanic, 16.8% Asian, 0.2% Native American, 1.3% other
Majority-Minority District; New Majority-Hispanic
Downtown Los Angeles is a good description of CA-33. Its one weakness is that it splits East Los Angeles with the previous district. This happens only because it was impossible to draw the district within the required population deviation without splitting the city, given the application's gigantic 20,000 person population blocks. With more detailed data, East Los Angeles would certainly stay within one district.
CA-34 (Lime Green):
Population â 16.5% white, 2.3% black, 68.4% Hispanic, 11.4% Asian, 0.2% Native American, 1.2% other
Majority-Minority District; Majority-Hispanic
CA-34 takes in poor, primarily Hispanic communities in downtown Los Angeles. Seeing a pattern here?
CA-35 (Dark Orchid/Purple):
Population â 5.2% white, 40.9% black, 45.6% Hispanic, 5.9% Asian, 0.2% Native American, 2.2% other
Over-18 Population - 43.2% black, 41.4% Hispanic
Majority-Minority District
Don't be fooled by the Hispanic plurality; this district is drawn to elect a black representative. It takes advantage of low Hispanic turn-out and high black turn-out to ensure that even a Hispanic-plurality district will probably elect a black representative.
Right now there are in fact three black congresswomen representing this area, an relic of the time when South-Central Los Angeles was far less Hispanic and far more black. Given that the black population has absolutely plummeted in the past twenty years, this situation is not sustainable. A black-plurality over-18 district would probably elect a black congressman for the next ten years, even as the black population continues to fall.
CA-36 (Orange):
Population â 47.6% white, 5.2% black, 26.8% Hispanic, 16.4% Asian, 0.2% Native American, 3.8% other
Majority-Minority District
The wealthier western coastline of Los Angeles is home to CA-36. This district divides the Rancho Palos Verdes area in two; it's impossible to get within the correct population deviation without doing so. This would not happen with more detailed data. More concerning is the fact that it takes in several poor downtown cities that have little in common with the wealthy coastline communities; this happens because those areas are too Hispanic to be incorporated into the previous district and thus have no place to go but here.
.
Long Beach
There are two congressional districts located in Long Beach.
CA-39 (Moccasin):
Population â 13.1% white, 14.5% black, 57.7% Hispanic, 12.5% Asian, 0.2% Native American, 2.0% other
Over-18 Population - 15.9% white, 15.2% black, 52.9% Hispanic
Majority-Minority District; Majority-Hispanic
This district covers several more poor, primarily Hispanic communities north of Long Beach.
CA-37 (Dodger Blue):
Population â 46.1% white, 6.5% black, 31.4% Hispanic, 12.6% Asian, 0.3% Native American, 3.1% other
Majority-Minority District
While this district looks compact, it does relatively poorly in communities of interest. Long Beach is a primarily Hispanic, industrial, and relatively poor community. On the other hand, Rancho Palos Verdes and Huntington Beach are primarily white, suburban, and wealthy communities. The trouble is that Long Beach is a large city, but doesn't have enough population to support its own district. Unfortunately, given the design of this map, there is nowhere else for Long Beach to find more population than Rancho Palos Verdes and Huntington Beach.
.
Final Thoughts
There were three decisions which formed the basis of the Los Angeles area - the decision to make a majority-Asian district, the decision to make a black-controlled district, and the decision that no district would cross-over the mountains from the Los Angeles metropolis into the Antelope Valley.
These three rational decisions, however, are ultimately responsible for the weaknesses that do occur in the map. The reason Long Beach has to be combined with unlike communities is due to this, for instance.
More troubling is the way in which CA-31 packs Hispanics. CA-31 is located in one of the most Hispanic parts of the entire country, and any district in this area will have a very high Hispanic percentage. Still, the 88% number is quite high. The problem is that there is nowhere for the district to go. The areas to its north, south and east are just as Hispanic, so moving there won't fix the problem. West of CA-31 is the black-controlled CA-35. However, taking in some less Hispanic territory there would end up destroying the only district designed to elect a black representative in all of California. The only other options would be to run thing, long strips from downtown Los Angeles to the Asian areas of the San Gabriel Valley (destroying a district designed to elect an Asian representative), or alternatively the white areas of Glendale and Pasadena (horrendous in terms of compactness and communities of interest). Once again one runs into the constant trade-offs present with redistricting.
The next post will take a look at Orange County, part of the overall Southern California area:
--Inoljt
