With this map, North Carolina would likely gain one liberal democrat and one center-left democrat, bringing the delegation to 9 Democrats and only 4 Republicans.
All racial data VAP.


District 1: G.K. Butterfield (D-Wilson)
69-30 Obama 70-30 Democratic 50% Black, 40% White, 6% Hispanic
(Touch-point contiguity at High Point)
Butterfield is probably the only Democrat who would not like the new map, since his new district would contain mostly unfamiliar territory.
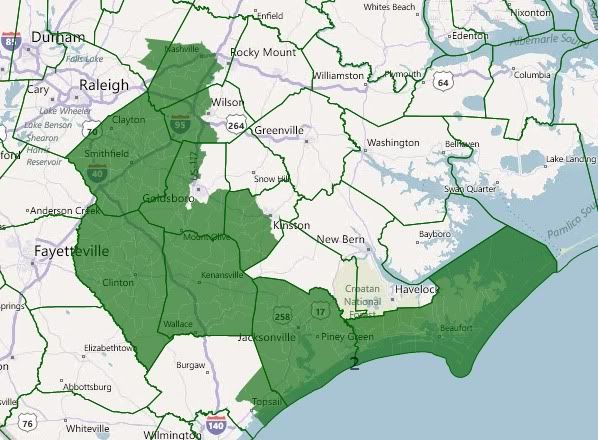
District 2: Walter Jones (R-Nashville)
61-38 McCain 58-42 Republican 71% White, 18% Black, 9% Hispanic
Includes much of Jones' current territory, but the actual 3rd district moves to the east. He is basically a democrat, with his anti-war, pro-raising taxes on the rich and pro-Medicare positions. He'd probably survive a primary challenge, as many Republicans in this district are former Democrats, like Jones.
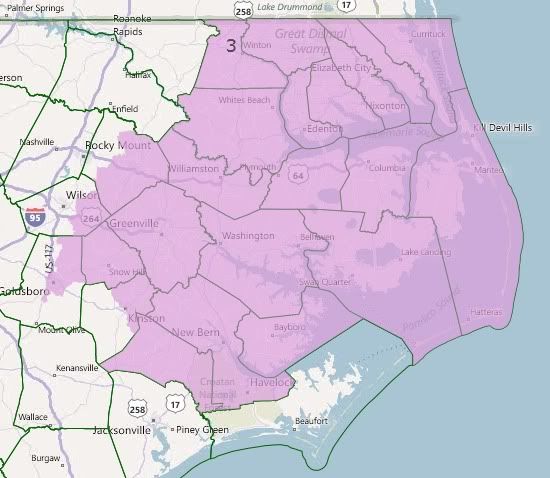
District 3: OPEN
51-48 Obama 54-46 Democratic 61% White, 32% Black, 4% Hispanic
This district would almost certainly elect a Democrat. The Obama numbers are a little low, but the numbers for statewide races are much higher.

District 4: David Price (D-Chapel Hill)
63-36 Obama 59-41 Democratic 70% White, 14% Black, 7% Asian, 7% Hispanic
Safe Democratic. I did my best to create a liberal white VAP district. :) They are a rarity in the South.
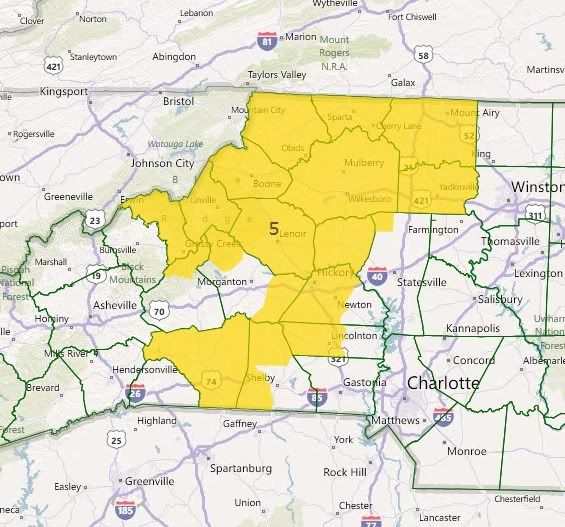
District 5: Virginia Foxx (R-Blowing Rock)
64-35 McCain 62-38 Republican 88% White, 5% Black, 5% Hispanic
This district is a Republican sink, by which I mean it sinks a Republican congressman/woman. Pat McHenry doesn't live here but he'd likely challenge Virginia Foxx for this seat. Neither is very well-liked in their district, so who knows what would happen here.
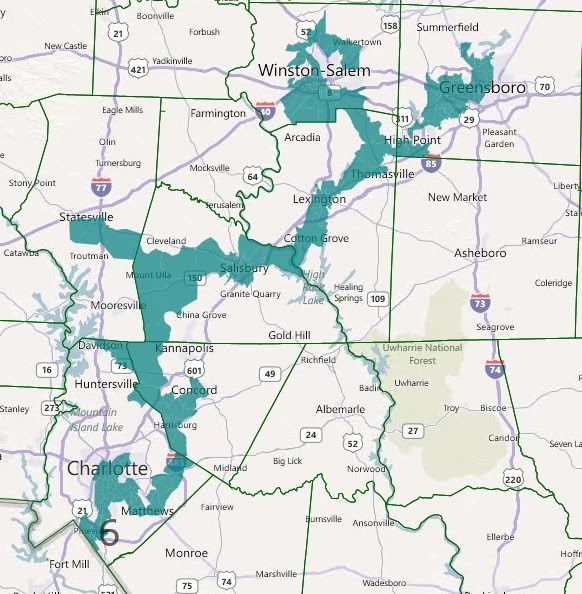
District 6: OPEN
57-42 Obama 53-47 Democratic 65% White, 22% Black, 9% Hispanic, 3% Asian
(Touch-point contiguity at High Point)
This district would have a good chance at electing a fifth liberal democrat to NC's delegation. The north and south ends of this district take in the leftovers from the Triad and Charlotte, while the I-85 part of the district takes the shape of Mel Watt's current district... I know, we couldn't get rid of it. :P
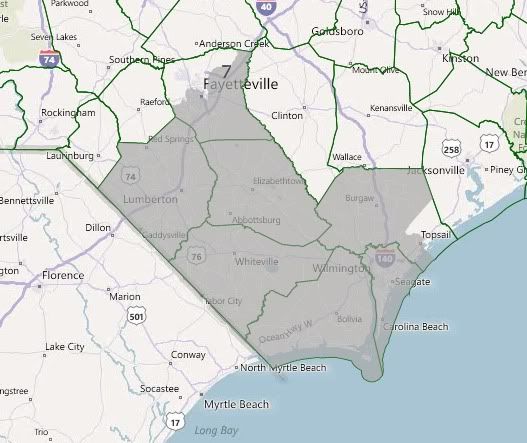
District 7: Mike McIntyre (D-Lumberton)
52-48 McCain 51-49 Democratic 65% White, 20% Black, 5% Hispanic
Takes in more of Fayetteville and loses Sampson & Duplin. Still safe for McIntyre.
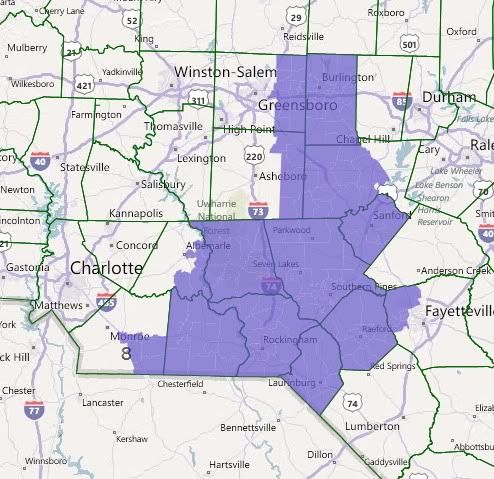
District 8: Larry Kissell (D-Biscoe)
50-49 McCain 50-50 Democratic 63% White, 24% Black, 9% Hispanic
This district probably fits Kissell's voting pattern better than his current district. He's really not safe anywhere, but he could win here.
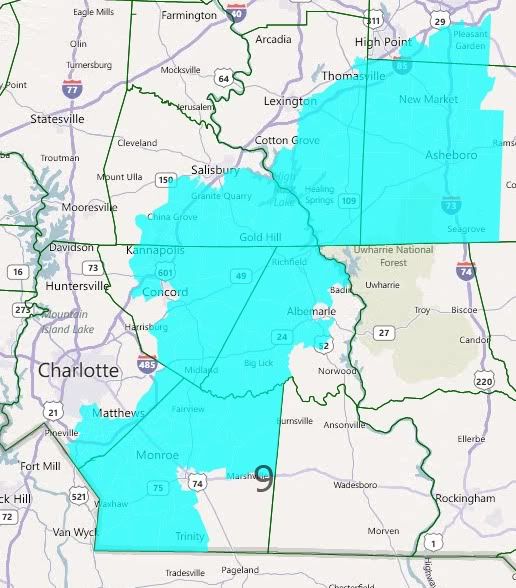
District 9: Sue Myrick (R-Charlotte)
65-34 McCain 67-33 Republican 83% White, 7% Black, 6% Hispanic
Runs east of I-85 from Charlotte to Greensboro. Very safe for Myrick.
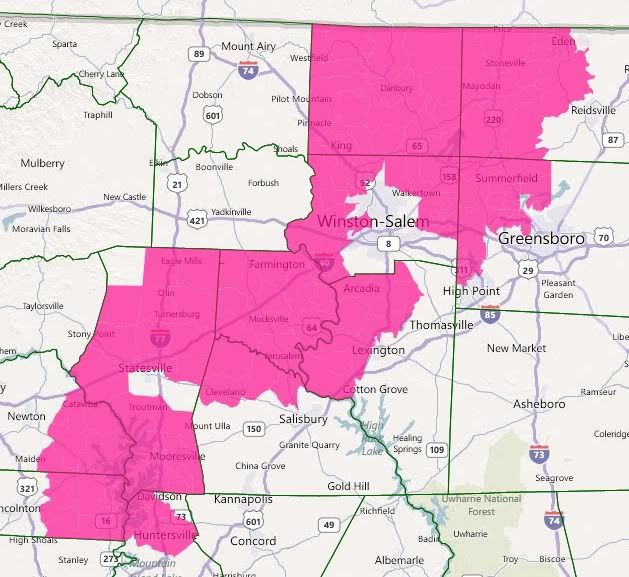
District 10: Howard Coble (R-Greensboro)
63-36 McCain 65-35 Republican 85% White, 8% Black, 4% Hispanic
Coble's pretty old, but he's showing no signs of retiring yet. Regardless, he could get a primary challenge from Patrick McHenry here.
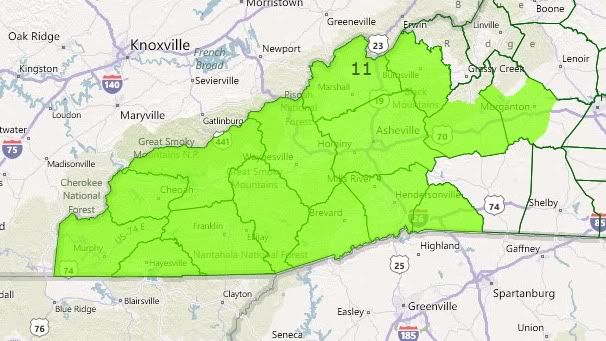
District 11: Heath Shuler (D-Waynesville)
52-47 McCain 52-48 Republican 88% White, 4% Black, 4% Hispanic
Doesn't change much. Safe for Shuler in the general, but he's still vulnerable in a primary.
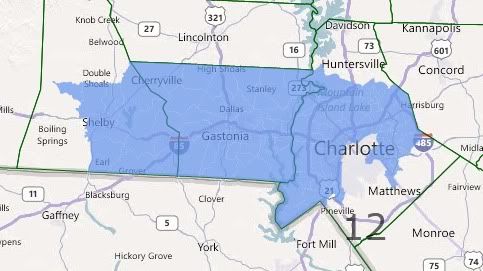
District 12: Mel Watt (D-Charlotte) vs. Patrick McHenry (R-Cherryville)
62-37 Obama 60-40 Democratic 49% White, 35% Black, 11% Hispanic, 4% Asian
Less AA than before, but the 12th becomes more compact with this map. And I threw Cherryville into this district just to screw McHenry. If only this map were real....
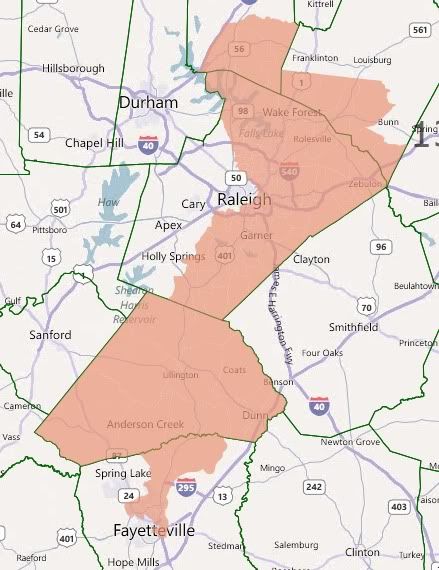
District 13: Brad Miller (D-Raleigh) vs. Renee Ellmers (R-Dunn)
55-44 Obama 54-46 Democratic 60% White, 27% Black, 9% Hispanic
Not quite as Democratic as before, but Miller could still beat Ellmers here any day. This district takes a shape similar to the current 2nd, actually.
And that's all!
Thoughts?
