This begins a two-part effort to suggest Congressional maps for the state of Minnesota. The second proposal will be posted tomorrow.
Our current district boundaries were drawn by the courts with the aim to be nonpartisan. However, the partisan lean that was slightly evident at the beginning of the decade became more pronounced as we reached the present day.
Each seat has a "lean" when compared to the statewide average as a whole (think of it as version of Cook's PVI where a district is compared to the state's electoral results rather than the US as a whole, although I like to employ victory margin rather than partisan percentage, since Minnesota elections often involve a relatively-significant Independent candidate). This is different than the simple metric of which party "won" the district.
While most obvious during a dead-even election (like 2008 Senate and 2010 Governor), where the partisan lean and margin of victory for a party are basically matched, this lean can be calculated in non-close elections with the simple equation of Democratic Margin of Victory for District minus Democratic Margin of Victory Statewide (you can switch the Party in the equation to Republican, it's cool).
For you fellow math geeks, here's a more algebraic representation of the equation:
D Margin of seat – D Margin statewide = Seat Partisan Lean
The current 5th District, which features Minneapolis and several inner-ring suburbs, chose Obama over McCain by 50.3%, which exceeds Obama's statewide margin of 10.2% by 30.1 percentage points. Hence, for 2008, MN-5 had a lean of +40.1 D. MN-6, which chose McCain over Obama by a margin of 8.5% (or a Democratic margin of -8.5%), has a lean of +18.7 R in '08.
A legitimately fair nonpartisan map would push to create an equal number of districts that lean towards each major party, and it can be done in Minnesota without splitting of counties and municipalities in excess of what presently exists.
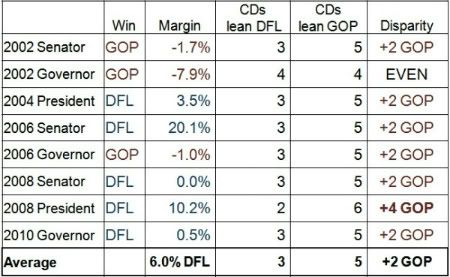
Why am I yammering about this partisan lean? Because a court-drawn nonpartisan map should seek to avoid provision of an advantage to either political party. Those two uberclose Minnesota elections referenced above resulted in the GOP candidate winning 5 of the 8 CDs by at least 5 points, leaving the DFL candidate with merely three. This was due to the DFL voters being packed into MN-4 and MN-5.
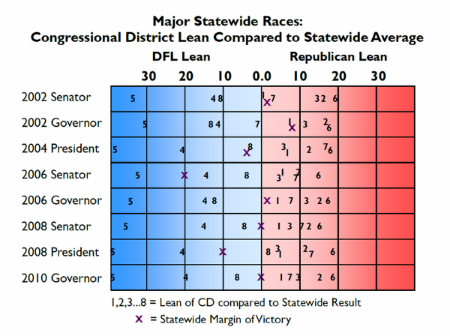
This table displays the results and partisan lean for the eight major statewide races this decade. Each CD's number is placed along the left-right continuum, indicating it's lean compared to the statewide result. The purple X indicates the actual victor and margin. Notice that each district's lean was not significantly affected by which side won and the margin of victory, but is essentially baked into the district's design.
This same phenomenon exists with seats in the State House of Representatives, and reveals just how Minnesota's district landscape offers the GOP a sizable edge.
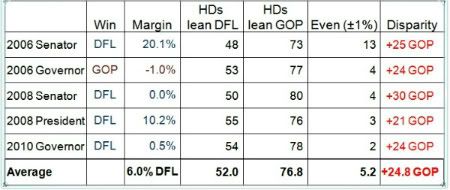
I seek to illuminate how Minnesota's nonpartisan mapmaking process, in order to create a legitimately fair map that does not provide a built-in advantage for one party over the other, should be aware of the partisan realities of their districts, rather than ignore them. When they are "ignored", significant structural advantages are provided to the GOP.
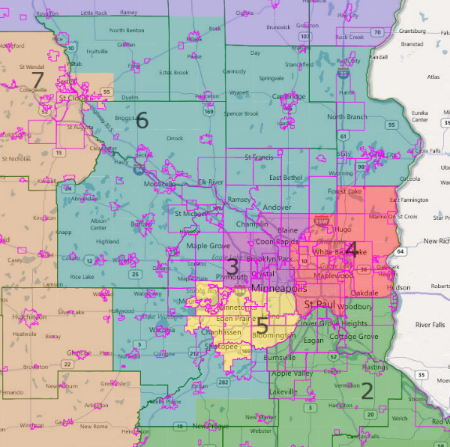
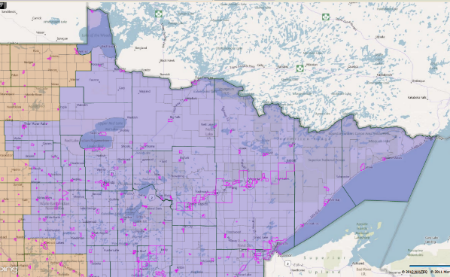
Proposal One – A 4-4 Split
This Congressional map creates four districts that would have fallen on both sides of the margin of victory for each of the eight major statewide races listed above. Minneapolis, the only split municipality that does not involve a county border, maintains its COI credentials by employing I-94 and I-394 as the boundary between the new 3 and the new 5. In general, these districts offer a similar fealty to communities of interest as previous boundaries, just with less favoritism towards to GOP.
Note – freeways are often an inferior boundary, because for many cities, they involved the destruction of established neighborhoods. For this exercise, I've aimed to minimize any effects this division would have on representation by ensuring that communities along this corridor have influence within more districts than the current map, enhancing their opportunity for representation by a candidate of their choice.
Let's look at this for a second. I know the "good-government" brigade – of which I consider myself, may not approve of anything that even smells of partisanship while mapmaking. But as I mentioned above, a map will not reflect the actual preference of the voters in a fair manner if we only look at localities and ignore the politics.
In addition, it is odd that people would become apoplectic about splitting Minneapolis, a city with distinct north and south sides, all while little (if any) criticism is aimed at the current map's choice to break apart several municipalities. Woodbury, Coon Rapids, Hopkins and a whole mess of other towns have a fraction of the population of Minneapolis, and cracking a smaller town creates far more community-of-interest issues. Besides, almost every other state with a major city of 350,000 has little concern in splitting it across multiple districts. OK, that said, let's check it out:
District 1: southern Minnesota
Current Rep: Tim Walz (D-Mankato)
2010 Results: Dayton 39.9%, Emmer 45.5%.
2008 Results: Obama 51.0%, McCain 46.6%.
Current Ethnicity: 89.0% white (91.4% VAP), 5.2% Hispanic (3.9% VAP)
Current Partisan Lean (based on the eight major races): R+5.3%
Proposed 2010 Results: Dayton 39.7%, Emmer 45.7%.
Proposed 2008 Results: Obama 50.7%, McCain 46.8%.
Proposed Ethnicity: 89.0% white (91.4% VAP), 5.1% Hispanic (3.9% VAP)
Proposed Partisan Lean (based on the eight major races): MN R+6.1%
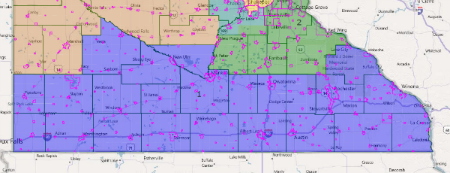
The 1st maintains most of its current layout, adding Redwood County to its present setup of the Winona-Worthington I-90 Corridor, the Mankato-St Peter-New Ulm "micropolitan" area, and the city of Owatonna. Two municipalities - Lake City and Pine Island – cross county lines, yet remain wholly within the 1st district (for population purposes). Rep. Walz survived the Republican Torcano of 2010, and should be able to hold this seat despite a slight GOP boost in this new map. However, if it opens, the GOP will have the edge.
District 2: St Paul's southern and southeastern suburbs, south-central towns and cities
Current Rep: John Kline (R-Lakeville)
2010 Results: Dayton 35.8%, Emmer 50.3%.
2008 Results: Obama 48.3%, McCain 49.8%.
Current Ethnicity: 85.5% white (88.1% VAP), 3.2% Black/African American (2.8% VAP), 4.8% Hispanic (3.8% VAP), 4.1% Asian American (3.9% VAP)
Current Partisan Lean: MN R+12.7%
Proposed 2010 Results: Dayton 39.5%, Emmer 46.4%.
Proposed 2008 Results: Obama 51.4%, McCain 46.6%.
Proposed Ethnicity: 83.9% white (86.9% VAP), 3.9% Black/African American (3.4% VAP), 5.5% Hispanic (4.4% VAP), 4.2% Asian American (3.9% VAP)
Proposed Partisan Lean: MN R+6.9%
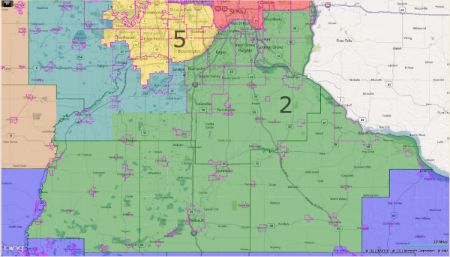
The 2nd also closely resembles the current incarnation. The most notable adjustment: Dakota County would remain whole within the new district, contrasting with the two-way split of the current map, and most Scott County segments are ceded to the 6th District. Outside of that, the new 2nd echoes the current map, connecting towns in Washington County that fall south of I-94 with their Dakota County brethren, yet avoiding the municipality splits of the current seat.
This district aims to keep St Paul's southern and southeastern suburbs together, Maplewood excepted (as it would require another county split).
The other major county split keeps the COI of New Prague, Montgomery and Lonsdale (three towns with a large Czech ancestry) within the 2nd.
Rep. Kline would likely hang on here, but the safe Republican pastures a few miles west might be too great a lure to remain in a newly-moderate seat.
District 3: All of Minneapolis north of I-94 and I-394; suburbs north of I-394, first and second-ring suburbs in Anoka County that primarily associate with Minneapolis.
Current Rep: Erik Paulsen (R-Eden Prairie)
Rep in new map: Keith Ellison (D-Minneapolis)
MN-3 current statistics:
2010 Results: Dayton 38.6%, Emmer 47.4%.
2008 Results: Obama 52.2%, McCain 46.2%.
Current Ethnicity: 79.0% white (82.7% VAP), 7.6% Black/African American (6.4% VAP), 3.9% Hispanic (3.1% VAP), 6.7% Asian American (6.2% VAP)
Current Partisan Lean: R+7.7%
Proposed 2010 Results: Dayton 49.9%, Emmer 38.0%.
Proposed 2008 Results: Obama 61.0%, McCain 37.1%
Proposed Ethnicity: 68.5% white (73.9% VAP), 14.3% Black/African American (12.1% VAP), 5.4% Hispanic (4.3% VAP), 7.9% Asian American (7.2% VAP)
Proposed Partisan Lean: D+ 11.6%
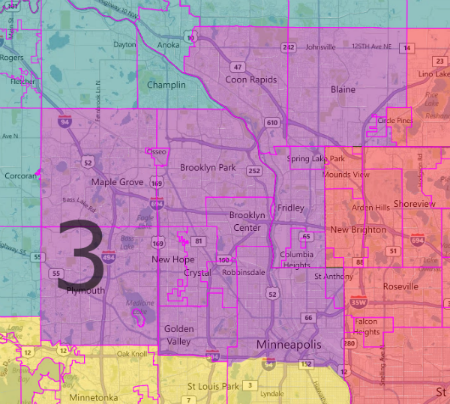
My goal was to create a seat primarily composed of the northern suburbs of Minneapolis with the northern half of the city, all while providing the one additional district required to split Minnesota's 8 CDs in to 4 leaning GOP, 4 leaning DFL (as we call the Democratic Party in the Gopher State). Rep. Ellison would likely do fine in this new configuration, which largely resembles the current 5th.
Most of these western and northern Hennepin County cities already fall within the current 3rd, so little adjustment for them will be required. The 3rd gained population, so the southern and southwestern Hennepin towns were added to the population-short 5th District. The southern part of Anoka County is excised from the 6th District (which becomes a more exurban COI seat) to finish the 3rd.
As for deciding which Twin-Cities' northern suburbs to allocate to which district, I began by keeping Ramsey County wholly within the nearby 4th, which simplified the process. The question becomes "Where would it be appropriate to split southern Anoka County between the Minneapolis-associated 3rd and the St. Paul-associated 4th?" I moved here about eight years ago, and lack knowledge of such details, so I realized that assignment of suburbs to city of choice would require the input of some locals.
With help from my wife's extensive collection of acquaintances that either currently reside or once lived within the towns along the border of my 3rd and 4th Districts, I was told that Blaine associates with Minneapolis; while Lino Lakes went for St. Paul "...if we absolutely have to choose a Twin City" (as for Circle Pines – "We are above all this parochialism", I was told). Problem solved.
For VRA Rule 2 purposes (Minnesota is not a Rule 5 state, nor has any Rule 5 counties or cities), the new 3rd and the new 5th could theoretically switch numbers so the 5th's current diversity will be reflected in the new 3rd, avoiding retrogression.
District 4: St. Paul, northern and northeastern suburbs.
Current Reps: Betty McCollum (D-St. Paul)
Rep in new map: McCollum (D-St. Paul), Michele Bachmann (R-Stillwater)
MN-4 Current statistics:
2010 Results: Dayton 39.9%, Emmer 45.5%.
2008 Results: Obama 64.4%, McCain 33.6%.
Current Ethnicity: 69.1% white (75.1% VAP), 9.7% Black/African American (8.2% VAP), 7.6% Hispanic (6.0% VAP), 10.3% Asian American (8.4% VAP)
Current Partisan Lean: MN D+20.6%
Proposed 2010 Results: Dayton 50.3%, Emmer 36.5%.
Proposed 2008 Results: Obama 61.9%, McCain 36.2%.
Proposed Ethnicity: 72.1% white (77.3% VAP), 8.9% Black/African American (7.7% VAP), 6.1% Hispanic (4.9% VAP), 9.7% Asian American (8.0% VAP)
Proposed Partisan Lean: D+13.6
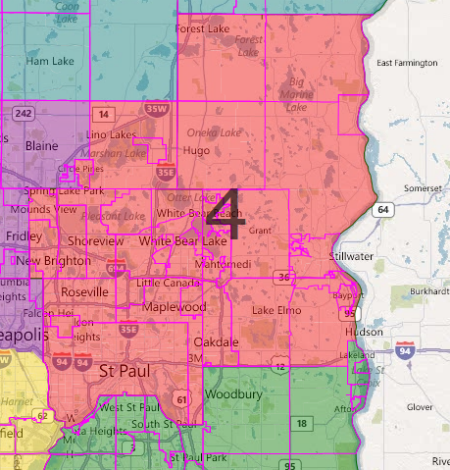
St Paul and Ramsey County remain in the 4th. All of Washington County north of I-94 (save the sliver of Lakeland that I wanted to keep whole) joins two eastern Anoka County municipalities to maintain population equality without cracking Chisago County in the new 6th District.
There's little doubt that Bachmann would choose another venue than the heavily-Democratic 4th District, but her surefire ascension to the Oval Office will deem such vagaries unnecessary. Um...or she could move to the new 6th, if News Corp's Brinks truckload of cash doesn't draw her away from her high calling to serve / dismantle our government.
District 5: Minneapolis; southern and southwestern suburbs
Current Reps: Keith Ellison (D-Minneapolis)
Rep in new map: Erik Paulsen (R-Eden Prairie)
MN-5 Current statistics:
2010 Results: Dayton 64.6%, Emmer 23.3%.
2008 Results: Obama 74.1%, McCain 23.8%.
Current Ethnicity: 65.4% white (71.3% VAP), 15.1% Black/African American (12.7% VAP), 9.5% Hispanic (7.6% VAP), 5.3% Asian American (5.1% VAP)
Current Partisan Lean: MN D+37.2%
Proposed 2010 Results: Dayton 51.8%, Emmer 34.3%.
Proposed 2008 Results: Obama 63.9%, McCain 34.4%.
Proposed Ethnicity: 76.1% white (79.9% VAP), 7.7% Black/African American (6.7% VAP), 7.9% Hispanic (6.4% VAP), 4.8% Asian American (4.7% VAP)
Proposed Partisan Lean: MN D+15.4%
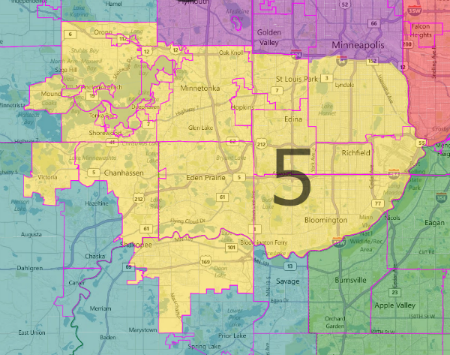
Continuing the pattern of crafting districts that group towns within similar regions, the new 5th connects the southern half of Minneapolis with its southern and southwestern suburbs. St Louis Park, Edina, and Richfield ring the southern half of Minneapolis; Eden Prairie, Bloomington and Minnetonka add Ring #2; and a third ring of Shakopee around to Orono finish the district. Ellison would no longer represent this territory, and Paulsen (R-Eden Prairie) would find that his best shot at maintaining Representative status would be a slight southeastern move to Savage in the new 6th District. If Kline also made a similarly short-distanced relocation, they'd have one epic primary battle (both would likely dispatch current incumbent Chip Cravaack).
Do not be alarmed by the apparent retrogression in diversity, for the new 3rd contains similar percentage of non-white voters as the current 5th.
This district is a textbook example of why emphasizing "clean lines" and "communities of interest" primarily benefits Republicans in partisan lean. Despite the President's statewide victory eclipsing double-digits, two seats where Obama received at least 70% of the vote (the current 5th, and if I packed the 4th with inner-ring suburbs) could easily be drawn without looking remotely like a gerrymander. In contrast, the creation of a seat where McCain received at least 60% of the vote would require a series of dips and droops reminiscent of the late Rep. Phillip Burton's 1980 California maps (not that such obstacles stopped North Carolina, Ohio or Texas Republicans from doing just that to Democrats).
District 6: Twin Cities exurbs; east-central towns and cities
Current Rep: Michele Bachmann (R-Stillwater)
Rep in new map: Chip Cravaack (R-Lindstrom)
Current MN-6 statistics:
2010 Results: Dayton 34.6%, Emmer 52.8%.
2008 Results: Obama 44.7%, McCain 53.2%.
Current Ethnicity: 90.3% white (92.0 VAP)
Current Partisan Lean: R+17.2%
Proposed 2010 Results: Dayton 30.7%, Emmer 56.8%.
Proposed 2008 Results: Obama 41.2%, McCain 56.7%.
Proposed Ethnicity: 92.4% white (93.9% VAP)
Proposed Partisan Lean: R+25.1%
District 6 prioritizes COI, gathering most outer-ring suburbs and exurbs of Minneapolis and St. Paul that fall outside of Dakota County (which I kept whole within the 2nd).
Outside of Carver, the western part of the 6th grabs Hennepin's far-west exurbs and all of Wright County. The northern half includes all of Chisago and Isanti Counties, the remainder of Anoka, the southern half of Mille Lacs County and the entirety of Sherburne and Benton Counties that do not contain the city and suburbs of St Cloud. I want to keep the St Cloud area, which occupies three counties, as intact as possible (see District 7).
Absent a primary challenge, either from a current GOP incumbent or former gubernatorial candidate Tom Emmer, Cravaaack would have little trouble holding this seat.
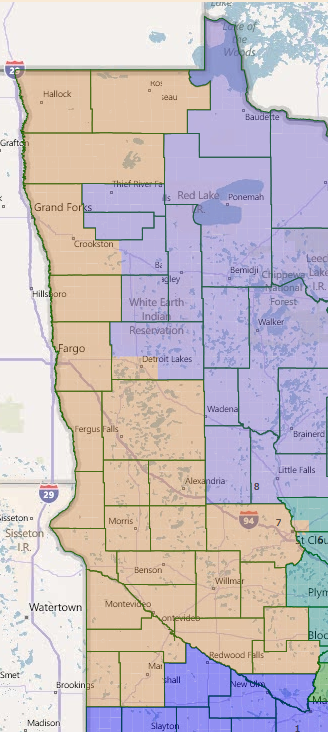
District 7: western and northwestern Minnesota
Current Rep: Collin Peterson (D-Detroit Lakes)
MN-7 current statistics:
2010 Results: Dayton 39.3%, Emmer 47.1%.
2008 Results: Obama 47.4%, McCain 50.1%.
Current Ethnicity: 90.5% white (92.7% VAP), 3.8% Hispanic (2.8% VAP)
Current Partisan Lean: R+9.6%
Proposed 2010 Results: Dayton 38.4%, Emmer 47.7%.
Proposed 2008 Results: Obama 47.0%, McCain 50.5%.
Proposed Ethnicity: 91.7% white (93.6% VAP), 3.7% Hispanic (2.7% VAP).
Proposed Partisan Lean: MN R+11.6%
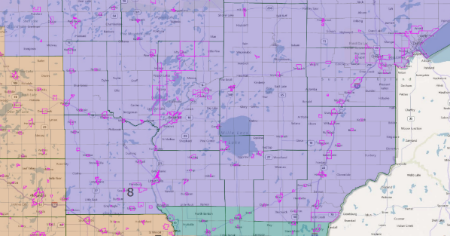
Close-up of St. Cloud area
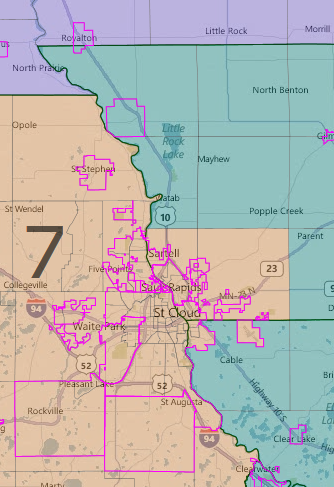
Consisting largely of intact counties along the western half of the state from Sibley & Renville through the Canadian border, the 7th changes very little, outside of shedding some northern territory in exchange for St Cloud, a municipality that occupies part of three counties. The precincts in the south-east quadrant of the St. Cloud-area map that remain in the 7th District - yep, these are also within St. Cloud's city limits. You know who ignored communities of interest? The original mapmakers, according to this city.
In order to meet population requirements, the 7th cedes precincts from southeastern Polk County to the 8th District, and all territory containing and bordering Band of Ojibwe reservations (White Earth and Leech Lake Bands). Due to the length of this district's eastern border, multiple modifications can be made, all without affecting the lean. Peterson, a survivor of the aforementioned 2010 Torcano, is basically safe. The DFL will have difficulty holding this seat when he retires, however.
District 8: Duluth/Iron Range, north-central and northeastern Minnesota
Current Rep: Chip Cravaack (R-Lindstrom)
Rep in new map: Open
2010 Results: Dayton 48.2%, Emmer 40.5%.
2008 Results: Obama 53.1%, McCain 44.5%.
Current Ethnicity: 92.9% white (94.3% VAP)
Current Partisan Lean: D+5.6%
Proposed 2010 Results: Dayton 49.6%, Emmer 39.2%.
Proposed 2008 Results: Obama 54.3%, McCain 43.3%.
Proposed Ethnicity: 90.8% white (92.7% VAP), 4.5% American Indian (3.7% VAP)
Current Partisan Lean: MN D+5.0%
North 8
South 8
Like the 1st District, the 8th mirrors the seats created within the We Draw the Lines campaign. The new 8th sheds St. Paul exurbs like Chisago County (home of Rep. Cravaack), aiming to maintain its current status as the Duluth – Iron Range seat. In addition, the annexation of precincts in the east-central part of the state collects all seven Bands of Ojibwe into a shared seat, permitting collective political involvement in (all likelihood) a caucus for a Congressional race (the geographic divide between the four Sioux tribes do not permit a similar district).
Proposal Two – coming tomorrow.
