Note: This is not intended as a "538 Blog" bashing diary so let me explain.
With less than a week until the election, I believe state polling is simply more accurate than using national polls or econometric indicators at forecasting what the final electoral map will be.
Some national tracking polls like Gallup, Rasmussen, etc. are wildly over sampling Red state voters and have Romney up by 5-7 points. This is in large part the source for the "Mitt-mentum" meme.
Remember, The electoral vote will select the next POTUS and not the popular vote which is what the national polls reflect.
So, my "Sam Wang > Nate Silver" title is referring to their respective methodologies and is not intended to be personal.
A few weeks back I discovered the work/website of Dr. Sam Wang and am passing it along to those who are also seeking a less political source for commentary on election.
The difference is basically Dr. Wang uses a more accurate state polling formula versus Nate Silver's dependency on national polls and his own proprietary economic models. (see update)
Dr. Sam Wang is the founder of the Princeton Election Consortium on polling meta-analysis and his excellent and very accurate work can be followed here:
http://election.princeton.edu/
For new followers here's a brief introduction to his highest-value product:
The Princeton Election Consortium’s main contribution is to give you a high-quality “thermometer” of exactly where the Presidential race is, based on state polls – and therefore the Electoral College, which is how the Presidency is determined. We do not use econometric indicators or national polls because these are only indirect measures (“What political science models really tell us,”).
The track record of our state-polls-only approach in past years is quite good. In 2004, on Election Eve, the median was Bush 286 EV, Kerry 252 EV – the exact outcome. In 2008, we predicted Obama 364 EV, McCain 174 EV – just 1 EV off from the final outcome of Obama 365 EV. (For true nerds: in the latter case, the error was effectively 0.1 sigma, which suggests that we might be overestimating the 95% confidence interval.)
This map is using the current polling data:
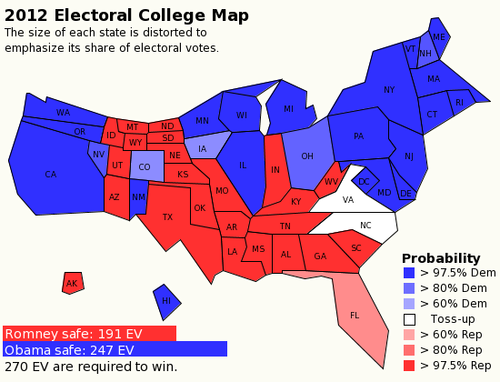
Hope this helps sort out who's truly winning this thing and how election night will most likely go.
Bonus: Pay attention to the "Meta-Margin" score at the top of the website. As long as it remains (+) Obama is going to win.
Update: Science Friday interview (Audio): Making Sense of Presidential Polls - http://sciencefriday.com/...
