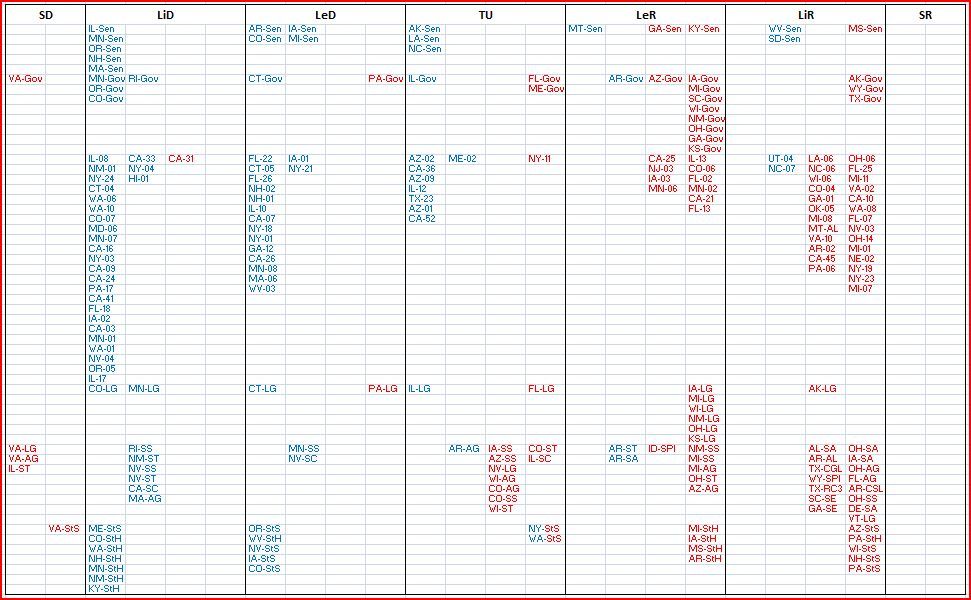
This is my rating chart updated to May 1, 2014:
Click in the image, to see it in larger size. First it will open the image in photobucket and then you can zoom to see the image in the natural size.
First a few notes about the chart (basically for the people that see the chart by firts time).
NOTES
This model of rating chart includes habitually:
- The rating of the presidential election by state (obviously not for 2014).
- The rating for the US Senate races.
- The rating for the Gubernatorial races.
- The rating for the US House races.
- The rating for the Lieutenant Governors that run in the same ticket than the Governor.
- The rating of the statewide elected offices including the separately elected Lieutenant Governors.
- The rating for who will win the majority of the state chambers.
Note: Many people is focused only in a few levels but I think every level has the own importance.
Also in every rate there are 4 columns:
- The first for offices with Democratic incumbent.
- The second for the offices open by a Democrat.
- The third for the offices open by a Republican.
- The fouth for the offices with Republican incumbent.
Note: The SafeD and SafeR groups only have the columns for the offices of the opposite party.
In the group of the statewide elected offices the races are named by the reference to the state and the first letters of every word:
- LG: Lieutenant Governor (in the case of the LG elected separetely).
- SS: Secretary of State.
- AG: Attorney General.
- ST: State Treasurer.
- SA: State Auditor.
- SC: State Comptroller.
- SE: Superintendent of Education (GA and SC)
- SPI: Superintendent of Public Instruction (ID and WY)
- CGL: Commissioner of General Land Office (TX)
- RC3: Railroad Commissioner 3 (TX)
- CSL: Commissioner of State Lands (AR)
Also, there is a color code that talk about the party that hold the office in the cycle. As example you can see the case of NJ-Sen. First blue (F Lautenberg D), later red (J Chiesa R) and finally blue (C Booker D). Also it talk about the change in the senate majorities of WA and NY thanks to the defection of some Democrats.
Then, the chart for the 2013-14 cycle is covering:
- 36 senate races
- 36 gubernatorial races
- 435 us house races
- 172 statewide elected offices (including all the Lieutenan Governors)
- 90 majorities in state chambers
Total = 769 (without count some cases of double elections in the cycle like in FL-13)
It is a too big number to make comments race by race in the diary.
Some races that have been done before the May 1 appear in the chart as safe at this point, to make easier a net count of gains and loses for the entire cycle.
This rating chart is calculated only following numerical rules that I designed for it. The rumerical rules are symetric and are the same for every case. It assures a not biased approach to the rating of electoral races. The numerical rules used are not totally fixed. After the last diary I made a little improvement to make smoother still the transition between the pre-poll calculus and the numbers after the first polls for every race.
As a chart with numerical origin, it is done with the public data until May 1 (in this case), the chart can be considered like a picture of the current situation and also is used in a predictive way as the election data gets closer. Updating the chart until the election day, the chart becomes a strong tool for me to predict the final results of every race.
Comparing this chart with the rating charts of DKE where they are rating 507 races, at this point there are only 4 disagreements (0.78%) in two cathegories (FL-22, AR-Sen, MN-06 and WV-02) and no-one in more.
CONCLUSIONS
Most of the things remain the same after the data of the last month. The fundamental trends for the cycle remain the same:
- US Senate: It is likely that the Democratic party have some net loses. These seats come from the 2008 elections that were positive. The Republicans have clear advantage to take 3 Democratic seats (WV, SD and MT). They come to a Toss-Up in 3 more (NC, LA and AK), and they are competitive in several more (AR, MI, CO and IA), but at same time, they need to care about KY-Sen (close to a Toss-Up rating in this chart) and GA-Sen. The majority is in play in the November elections, but the overall situation is not worse than a Toss-Up and the Republicans will need to work very hard in order to win.
- Governors: Most of the governors that run this year as incumbents were elected in 2010, a bad year for the Democratic Party. This is why the picture is different for the Democratic party in this front. Still the rating chart is not as favourable as should be in my view because there are many Republican incumbents in Lean R situation. They are weak but still favored. I think some of these races will break toward the Democratic Party by the end, but wich of them? For me AR-Gov, MI-Gov and NM-Gov have the strongest potential challengers, but everyone of the Republican candidates for these races can implode.
- US House: Until now, the races for the US House are giving me a situation very close to a tie. Only UT-04 and NC-07 seems likely loses for the Democratic party, while CA-31 and NY-11 seems the most likely loses for the Republicans. In this group there are very few Toss-Ups in my chart, and most of them are Democratic seats. This can lead to think about some (only a few) net loses for the Democratic Party. I give not a big range for the Toss-Up rating. All this would agree with the overall picture, that is giving for this cycle a little worse result for the Democratic Party than the cycle 2011-12.
- Statewide elected offices: This group of races are giving in the chart the best option. Here like in the gubernatorial front the incumbents come from the negative cycle of 2009-10, but a higher number of open by R offices make that we see more races in the Toss-Up range. It is time to take benefit from this situation. I expect some gains here because the Republicans hardly will improve their situation in the races rated as Toss-Up. In some case a weak Republican side can cause a more favourable rating, but this would not be the case in the races rated as Toss-Up.
- State chamber majorities: The prospect for this part of the chart is so close to the prospect for the US House. Also in this case the incumbents come in many cases from the 2011-12 cycle, and those who come from the 2009-10 cycle are facing new unfavourable maps, after the Republican redistricting. This why the rating chart is not giving a chance for many gains. But despite that, there is a chance to recover the control in the WA state senate and in the NY state senate, where some unloyal Democrats are giving to the Republicans the majority despite to win not the elections. It is possible to recover the control and I glad to see some strong primary challenges.
- Safe D to Lean D races: In this group of races the situation seems so stable for me, and I expect not races going to worse. HI-Gov is a race to watch closely. Until now, the Democratic Party has a fundraising lead in all the races of this group, except for:
MA-Gov: M Coakley, S Grossman
NV-ST: K Wallin
MI-Sen: G Peters
Also there is one case where the Democratic candidate must emerge as a strong fundraiser and take the lead in the following quarter after the retirement of the previous incumbent:
NY-21: A Woolf
Finally, the higher Republican pressure in the R+high races can make GA-12, AR-Sen or WV-03 to go to worse, but all the fundamentals in these races are right.
- Toss-Up races: In the group of races rated as Toss-Up the situation is not bad. As example, between the 29 cases rated as Toss-Up, the Republicans only have a fundraising lead until now in 10 of them (but likely losing the lead in NY-11 after this quarter):
IL-Gov and IL-LG: P Quinn and P Vallas
FL-Gov and FL-LG: C Crist
NY-11: D Recchia
IL-SC: S Simon
AZ-SS: T Goddard
CO-ST: E Markey
WI-AG: J Richards, R Ozanne and S Happ
NV-LG: L Flores
- Lean R to Safe R races: The Republicans are fighting strongly for the majority in the senate, and they are ready to do some sacrifice to improve their prospect in this front, but they can not afford much more. The Republicans are showing bigger weakness than the Democratic party in the range of races where they would be favored. They have enough work to keep under control the races in this side of the rating chart before begin to think in more gains outside the senate front (see IL-Gov or races of the US House). At this point the Democratic party is leading the total fundraising in 12 races of this range: AR-Gov, AZ-AG, GA-Sen, FL-02, NM-SS, NY-19, VA-10, AR-LG, NC-06, OH-SA, CO-05 and WV-02. And CO-06 is in a tie.
The biggest fight will be in the senate front. Outside it the Republicans have hard time deffending the races in the Toss-Up range, and even can implode in some aditional race especially in the gubernatorial front.
