That "Hottest Year on Record" claim for 2014, may be just a 'Statistical Blip'. As much as we all like simple 'recording breakers' to boost the hyperbole -- the temperature "record" that was broken in 2014, is measured in hundredths of a degree.
Hardly 'earth-smashing' ... statistically speaking.
NASA, NOAA claim 2014 was hottest year on record disputed by climate scientists
by Mark Whittington, examiner.com -- January 18, 2015
[...]
A number of climate scientists dispute the NASA and NOAA findings. The climate change skeptics, whom global warming advocates call “deniers,” point out that the 2014 temperature readings are .04C degrees above similar readings taken in 2010 and 2005, well within the margin of error. They also suggest that the findings, taken primarily from data derived from surface sensors, are less accurate that those from satellites. The satellite data suggest that the 18 year plus “pause” in global warming has continued.
[...]
Even
NASA has put some "sidebars" around its recent Hottest Year claim. As are others, who are anxious to continue their 'procrastination' narrative ...
[ What!? Me worry? What Warming?]
SCIENTIFIC CONSENSUS that 2014 was record HOTTEST year? NO
by Lewis Page, theregister.co.uk -- Jan 19, 2015
[...]
Now, however, the BEST boffins have broken ranks with the NASA/NOAA/UK Met Office climate establishment and bluntly contradicted the idea that one can simply say "2014 was the hottest year on record". According to BEST's analysis (pdf) [Berkeley Earth Surface Temperature]:
Our best estimate for the global temperature of 2014 puts it slightly above (by 0.01 C) that of the next warmest year (2010) but by much less than the margin of uncertainty (0.05 C). Therefore it is impossible to conclude from our analysis which of 2014, 2010, or 2005 was actually the warmest year.
That may seem like not such a big deal, but it is really. At the moment the big debate in this area is about the "hiatus" -- has global warming been stalled for the last fifteen-years-plus, or not?
[...]
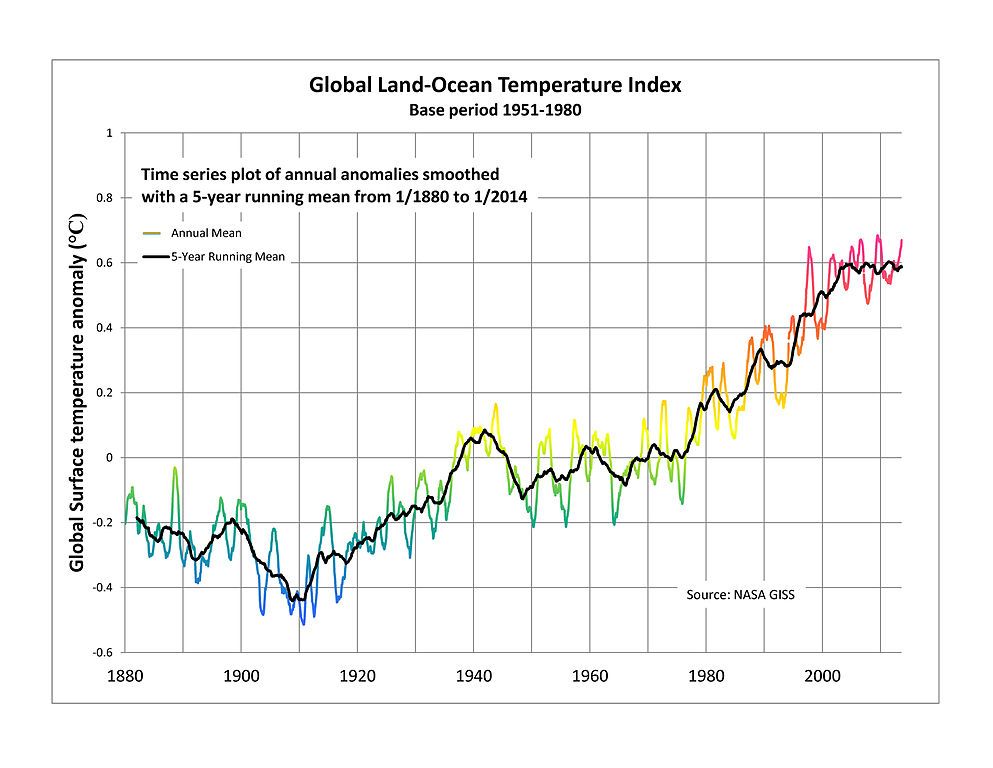 [Global warming hiatus: The colored line is the monthly mean and the black line is the five-year running mean. The global warming hiatus referenced in literature commonly starts circa 2000 and estimates vary. -- From Wikipedia]
When I first heard about this Climate Change "on hold" stuff (the relatively "flat" black line in the redline section of the chart above), I thought it was a statistical aberration. Then later, I thought: "the melting Polar Ice must be acting as some sort of 'Heat Sink'; the big wide Oceans too -- that must be where the 'excess heat' from the deepening CO2 blanket is going."
Turns out, I wasn't that far off the mark ... especially when you look at the "decades" time scale ... that Oceans turn on ...
Halt in Global warming is a hot topic in science circles
by Robert Matthews -- February 9, 2014
[...]
At the time, the claim was deeply controversial, and was challenged on the entirely reasonable grounds of insufficient evidence. Yet since then the evidence for a pause in the upwards trend has grown.
Climate scientists continued to argue it was a statistical blip, but now even leading advocates of man-made global warming accept that the pause is real, and demands explanation.
Last month, the leading science journal Nature -- not known for its denial of climate change -- looked at the current best guesses as to the likely cause of the pause.
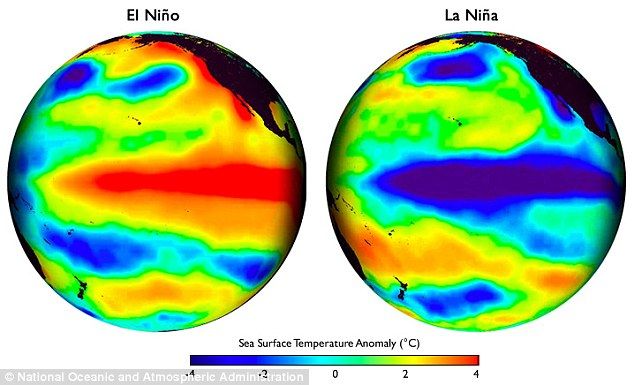
Top of the list, ironically, is the phenomenon widely blamed for the record-breaking peak global temperature in 1998: El Niño.
[...]
 [The 1997-1998 El Nino is estimated to have caused over 23,000 deaths worldwide. (source). -- readynutrition.com]
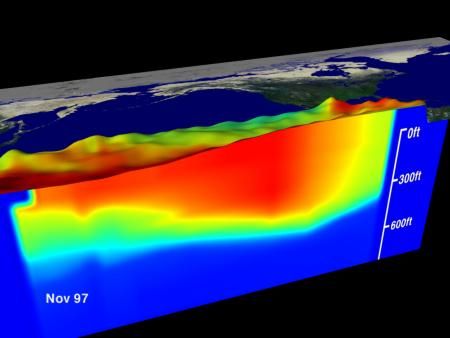
Here's the thing about that record-breaking 1998 El Niño -- it left a very large pool of cool water, in its wake. Cold Water -- from the depths of the Pacific -- that has in theory, been 'buffering out' the the CO2 Warming we would have/should have otherwise seen, ever since.
Or so much of the latest Global Warming 'Hiatus' research shows ...
[...]
The 1997-8 El Niño event was particularly dramatic, and is widely blamed for everything from floods in Chile to droughts in Indonesia. It is also thought to be the cause of that sudden spike in global temperatures.
But almost immediately afterwards, colder waters from deep within the Pacific moved in to the same area. This is now seen as part of an even grander weather cycle, called the Pacific Decadal Oscillation (PDO).
[...]
The episodic El Nino and La Nina events that we experience as seasonal anomalies, themselves are driven by long-term equatorial phenomena, of the Oceans acting like giant 'solar collectors.'
And in so doing, the 'widen or narrow' the semi-arid regions of the world, to match their current 'dry vs wet' cycles, of the equatorial Pacific Decadal Oscillation.
Climate: Scientists study link between tropical belt expansion and multi-decadal oceanic circulation patterns
by Bob Berwyn, summitcountyvoice.com -- March 19, 2014
[...]
Now, a team of climatologists, led by researchers at the University of California, Riverside, posits that the recent widening of the tropical belt is primarily caused by multi-decadal sea surface temperature variability in the Pacific Ocean. This variability includes the Pacific Decadal Oscillation (PDO), a long-lived El Niño-like pattern of Pacific climate variability that works like a switch every 30 years or so between two different circulation patterns in the North Pacific Ocean. It also includes, the researchers say, anthropogenic pollutants, which act to modify the PDO.
[...]
Allen’s team has found that the recent tropical widening is largely driven by the PDO.
[...]
Tropical widening is associated with several significant changes in the climate, including shifts in large-scale atmospheric circulation, like storm tracks, and major climate zones. For example, in Southern California, tropical widening may be associated with less precipitation.
Of particular concern are the semi-arid regions poleward of the subtropical dry belts, including the Mediterranean, the southwestern United States and northern Mexico, southern Australia, southern Africa, and parts of South America. A poleward expansion of the tropics is likely to bring even drier conditions to these heavily populated regions, but may bring increased moisture to other areas.
[...]
 [Will a strong El Nino, similar to the event of 1997/1998, occur any time soon? -- people.earth.yale.edu]
And not only does the Pacific act like a global "solar panel" gathering up and store the sun's relentless energy -- it also also periodically act as a "Heat Radiator" -- when it suddenly "off-loads" much of that excess energy too. Like during a months-long El Nino stormy outburst event; which in reality also act as a global 'heat-spreading' event (send "warming" from the equator to the mid latitudes.)
And it seems that after that Heat Sink "draining" its stored solar energy -- and with the deep upwelling of cold water, to replace the warm -- it can take some time to rebuild the ocean solar reserves again, as it were.
But rest assured, it will recollect those global BTUs. Enough even, to flip the "Hiatus switch" ... back to On.
Warming Pacific Drives Global Temperatures
Major warming in the Pacific Ocean has driven up global temperatures, impacted El Nino, affected weather systems and could signal the end of the so called global warming pause, say two leading climate scientists
by Leon Clifford, reportingclimatescience.com -- Nov 15, 2014
[...]
The change in the IPO [Interdecadal Pacific Oscillation] from a negative cooling phase to a positive warming phase is thought to have accompanied the recent unprecedented warming of northern Pacific waters. “From around the end of January there was a huge warm water build up off the Alaskan coast and a warming of the north Pacific,” Timmermann told reportingclimatescience.com. “Quite remarkable. I have not seen anything like this before in the northern Pacific”.
NCAR's [National Center for Atmospheric Research] Trenberth linked events to changes in the Pacific Decadal Oscillation (PDO) which is similar to the IPO in that it is a long-term cyclic variations in sea surface temperatures. “The fact is that there has been extraordinary warming in Alaskan waters and there were changes throughout the Pacific,” explained Trenberth. “The key thing is that the PDO is recorded as having changed phase,” he explained.
End of the global warming pause
Timmermann is very clear about what this means for global warming. “Over the last 15 years or so -- the period of the global warming hiatus -- the Pacific has been anomalously cold and there has been a very strong negative IPO,” explained Timmermann. “This has now stopped. The negative IPO has stopped. This is the same as saying the global warming hiatus has stopped.”
[...]
 [The Relationship of the PDO to El Nino and La Nina Frequency -- intellicast.com]
In other words, the oceans do act as global 'heat sinks' (and alternately as 'heat radiators' too.) "Luckily" for us, it takes a while for Oceans to heat up. Will they ever heat up clean on through and through, is anybody's guess. But the BTU collecting is ongoing, even as we dither about the details.
a few other Hiatus "causes" worth dithering
There are a few other theoretical contenders for the cause(s) behind the Global Warming "Hiatus" in the escalator of global temperature averages.
I suspect, they each play 'a role' -- given the extreme complexity of the Global Climate System. Given all the interacting feedback loops, and the occasional dampening loops ...
Study Shows Volcanoes May Be Causing Global Cooling
by Brian Wu, sciencetimes.com -- Jan 13, 2015
[...]
But while scientists may have arrived at a consensus that our planet is warming, according to a new study published this week, some of the warming effects have been offset by small volcanic eruptions over the last decade. The vast quantities of ash and gases ejected from the volcanoes have had a remarkable cooling effect on the climate, by blocking solar radiation.
[...]
Sunspots 2015:
Year of the decline
by Steve Davidson, commdiginews.com -- Jan 5, 2015
[...]
If solar physicists are correct, solar activity could be very low for several decades to come. How that will affect climate change is anyone’s guess, but low sunspot activity has already been identified by the United Nation’s International Panel on Climate Change (IPCC) as one of the main causes for the 15+ year “hiatus” from atmospheric global warming.
[...]
In other words,
LOTS of global variables ... with still
too little global action ...
We may have a few more years (decades?) of a 'grace period' to get our planetary house in order. A few more presidential cycles to debate the merits of 'statistical blips', competing computer models and theories, and the resulting 'no pressing need' to act -- Not on this watch, not until that Next Study is done ...
But as we debate the minutia of whether a historical record was broken (or NOT!) -- the local areas of planet, continue to suffer the brunt of a Changing Climate -- whether or not, they are registering on a Global and/or Political time-scales.
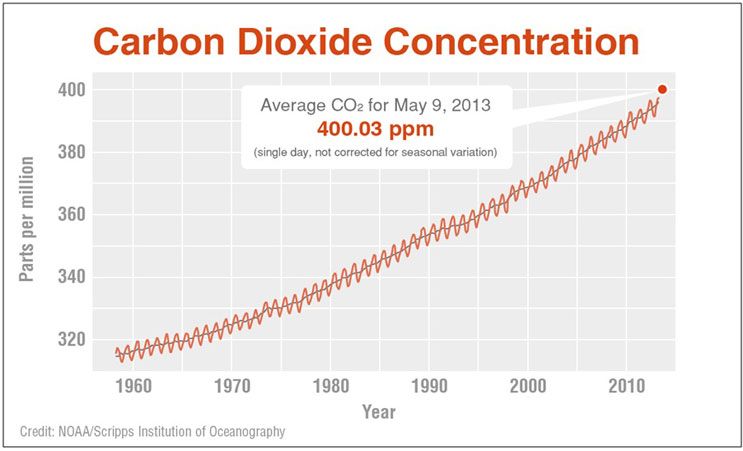
[The global concentration of carbon dioxide in the atmosphere hit 400 parts per million for the first time in recorded history. -- climate.nasa.gov/news]
The regional fallout from global climate change marches on, as noted by Professor Timmermann, whether this or that record gets broken or not, with each passing CO2-BTU year:
Results
So during 2014 the waters of the northern, north eastern and central Pacific have all warmed significantly. This has had the effect of raising the global average surface temperature to record levels which will almost certainly result in 2014 being reported as the warmest year on record.
[...]
Meanwhile waters off the coast of Hawaii reached 29°C or 30°C through the summer [84.2 to 86°F], according to Timmermann, causing corals to die and bleach. “We have seen temperature anomalies of 4°C in some area -- very extreme. This warming is bad news for salmon fisheries and also for coral. Fish and sea life are experiencing this year what we are projecting for 100 years time,” said Timmermann.
I wouldn't count on 'benevolent PDO reversals' to keep
"saving the Climate day" -- because as we can see in the CO2 chart above, that planetary heat trapping insulator, show no signs of reversing trends anytime soon.
Or put in more common street vernacular, our increasingly hotter oceans probably means: "If we don't act soon -- our global goose will one day be cooked."

