Sorry, unless you are bioblitzing right now, you missed this one. Today is the final day in the 2017 City Nature Challenge, a citizen science project covering 16 cities in the U.S. Over 3,000 enthusiastic nature lovers had submitted >75,000 observations of >6,000 species to iNaturalist by late afternoon of day four. The five day event runs April 14th through 18th and so far the most frequently observed species among all 16 urban areas are mallard (340 observations), American robin (274) honeybee (267), western fence lizard (251), and pinkladies (248). That last species isn’t native to most of the 16 cities involved (Oenothera speciosa is native to the southwestern states) and honeybees are not native to the U.S.
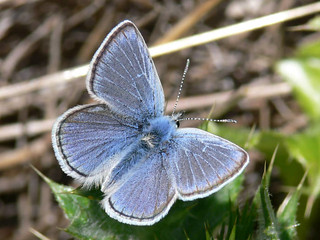 Mission Blue Butterfly (Photo by Patrick Kobernus/USFWS)
But native and non-native species are all part of an area’s biodiversity and knowing where they occur is important information. In last year’s initial two city BioBlitz Nature Challenge, Los Angeles (10,456 observations of 1,615 species) beat San Francisco (9,939 observations of 1,607 species). In addition to documenting biodiversity, observers reported endangered and iconic species.
In SF, the Mission Blue butterfly and the San Francisco garter snake were observed, and on the final night a trail camera in LA filmed P-22—the Griffith Park mountain lion.
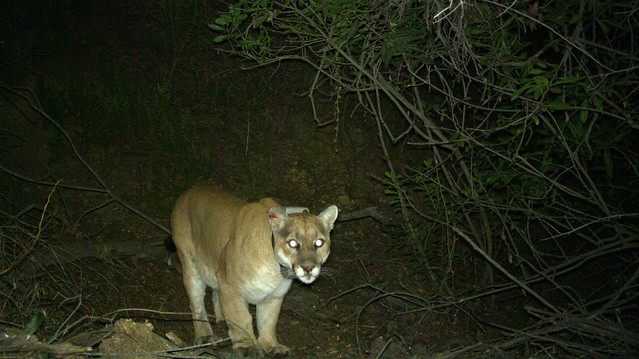 P-22 in Griffith Park from a trail camera in 2015. (Photo by National Park Service)
|
The Daily Bucket is a nature refuge. We amicably discuss animals, weather, climate, soil, plants, waters and note life’s patterns spinning around us.
To have the Daily Bucket in your Activity Stream, visit Backyard Science’s profile page and click on Follow. Phenology is how we take earth’s pulse describes how to write a Bucket of your observations.
|
Here’s how it works. Either as an individual or member of a group (for example in association with an organization), each participant downloads the iNaturalist app to their phone (submissions also can be entered at the iNaturalist website). During the event, take photos of plants and animals, then upload them to iNaturalist along with data such as location and day/time. You don’t even need to identify the species — others on iNaturalist will help with this.
Texas (Houston and Dallas) is the biggest challenger to California cities LA and SF this year.
Sixteen urban areas are competing. The total number of observations as of Monday 6-7pm are in brackets after the city name with the winner (at the time of writing this) in bold. The submissions are coming in so fast that between the time I checked one of the city pages on iNaturalist and reloaded the page, the numbers changed, sometimes adding over 100 new entries. Click on each city name to see the current data or visit the Natural History Museum of LA website for their compilation of live updates on all the cities. Each city page on iNaturalist also has the most recent photos and cites the species most commonly reported plus the people with the most submissions. Leading participants, at the time I am writing, are wbsimey with 941 submissions and gcwarbler (bet he’s a birder) with 426 species.
- Austin [10,660]
- Boston [2,250]
- Chicago (Cook County) [1,617]
- Dallas / Fort Worth [14,318]
- Duluth / Twin Ports [228]
- Houston [10,016]
- Los Angeles [10,272]
- Miami (Miami-Dade County) [1,080]
- Minneapolis / St. Paul [690]
- Nashville [748]
- New York City [2,596]
- Raleigh (Research Triangle Area) [4,417]
- Seattle [1,240]
- Salt Lake City (and surrounding counties) [1,823]
- San Francisco [15,112]
- Washington D.C. Metro Area [3,112]
The most observed species from San Francisco (leading city at the moment) are all native plants: California poppy (131 observations), miner’s lettuce (97), western blue-eyed grass (96), orange bush monkey flower (90), and common yarrow (78).
Why do this? What’s the use of 75,000 photos of weeds, wildflowers, and wildlife from 16 urban areas? Scientists call this cheap data but they don’t mean inferior quality they mean fantastic bargain. It’s crowd-sourcing for science but instead of sending money via Paypal people send data via websites and apps. Scientists use citsci data in a variety of research studies that would be too expensive and time-consuming to do without this cheap data.
I wrote about a modeling study that examined barred owl invasion of spotted owl habitat to determine if pre-existing citsci data could be standardized for research. They found the citsci data consistent with the data gathered by radio-tracking studies and concluded that cheap existing data sets could be used to analyze other populations such as monarchs (data from Journey North) or bird species (Audubon’s Christmas Bird Count data).
Cheap citizen science data is so valuable the feds are getting in the game (I added bold below).
The Federal Crowdsourcing and Citizen Science Toolkit is designed to help government agencies — and anyone else who cares to learn from the publicly accessible site — properly design, launch, and track citizen science and crowdsourcing projects. [...]
…after analyzing 338 citizen science biodiversity projects around the world, researchers at the University of Washington estimated that the in-kind contributions of 1.3–2.3 million citizen science volunteers to biodiversity research have an economic value of up to $2.5 billion per year.”
Existing projects span diverse subject areas and are not restricted to biology. Over 1,000 amateur photographers and astronomers are being recruited to help Google and UC Berkeley make a movie of the coming eclipse: The Eclipse Megamovie.
NASA is seeking people anywhere to photograph clouds and record sky observations for NASA GLOBE Observer: Clouds. Your data will contribute to climate research and help scientists verify satellite data.
The National Optical Astronomy Observatory’s project Globe at Night is measuring light pollution. In 2017 alone people have submitted 6,254 data points for the project. The absence of darkness is a serious threat to animals and some plants. Light pollution obstructs bird migration and alters plant phenology.
SciStarter will help you find projects in dozens of different disciplines, in specific locales, or one that can be done anywhere.
Don’t miss out! BioBlitzes happen all year throughout the world. iNaturalist often is used to collect the data and by checking their project list you can find the next event near you.
Are you wondering who will win the 2017 City Nature Challenge? In the hour I’ve been writing this article, San Francisco added another 500 observations! Total observations from all 16 cities rose from 75,000 to 80,900.
Although the Challenge ends today at 11:59pm Pacific time, California Academy of Sciences won’t announce the winning city until Earth Day, April 22nd. But the real winners are the >3,000 people who joined in the BioBlitz and the >6,000 species documented. These data have many practical applications. For example, they are used to understand wildlife use of urban areas, weed management priorities, and to identify essential habitat for endangered species like the Mission Blue butterfly.
Those children in the top image might have a forest to show their children butterflies sipping nectar in meadow because in 2017 their curiosity about the natural world was piqued by a BioBlitz. Because they learned to care, they will learn to take care.
|
SPOTLIGHT ON GREEN NEWS & VIEWS POSTS EVERY SATURDAY AND WEDNESDAY AFTERNOONS (PACIFIC TIME) ON THE DAILY KOS FRONT PAGE. BE SURE TO LOOK FOR THE STORIES YOU MISSED. RECOMMEND AND COMMENT TO THANK METEOR BLADES FOR HIS DEDICATED CURATION.
|
Coming this weekend — the Daily Kos SciCli Blogathon
The Daily Kos SciCli Blogathon begins April 22nd. In the week between the March for Science and the Climate March, writers will share their reasons for Why I March including issues and actions involved in supporting science and addressing climate change. Our first SciCli Blogathon articles will publish Saturday April 22nd followed by two each day through Friday April 28th (usually but not always at 2:30pm and 5pm Pacific time).
This week of action focuses on how science and climate change are affecting our lives and our planet. Science provides information that helps us understand the world. Our future depends on how we use this information right now to address the consequences of our past that lead to the climate change chaos taking shape all around us. SciCli Blogathon writers will share their perspectives, from fluffy to somber, from inner feelings to outer actions. Science includes everything and climate change will affect everyone.
Follow the hashtags #MarchForScience and #ClimateMarch. Share SciCli Blogathon articles and your own content on social media. State why you support science and climate change actions.
An article promoting the Blogathon published Monday April 17th: Three Climate Scientists on “Why We March”


