I've been told that the recessions has been declared over. So I looked it up for myself.
There are those that honestly think you can make a sustainable economy based on people buying things they don't need with money they don't have. Then there are those who just want to sucker in the sheeple so they can fleece them one more time.
Finally, there are the sheeple themselves - so scared that they will buy into any feel-good message about Green Shoots that the politicians and media sells them, and even defend it.
What none of these three groups want is for the general public to know what the actual numbers really are.
They don't want me to show you what I am about to show you.
There's been two studies done recently that put things into perspective. One was done by Barry Eichengreen and Kevin O’Rourke, both professors of economics. The other was done by Paul Swartz for the Center of Geoeconomic Studies.
As you can see, worldwide industrial output is dropping as fast as it did during the Great Depression, while world trade is dropping even faster (which makes one wonder if Smoot-Hawley really wasn't as big of a deal as some make it out to be).
The other two charts show monetary inflation and massive government deficits. The two are directly related.
Those academics who are afraid of deflation think that these are good things. Consumers that are trying to stretch their meager paychecks think otherwise.
On a worldwide level, the recent stock market rally still doesn't come close to bringing us back to the disastrous level of the Great Depression.
Focus on America
Some will try to write off the charts above that this doesn't reflect what is happening in America. As if America is some sort of island disconnected from the rest of the world.
For those people I want to present a few other charts.

US Industrial Output
The drop is America's industrial output mirrors the drop in the world's industrial output, as well as the Great Depression experience.

It's a similar story for the stock market.
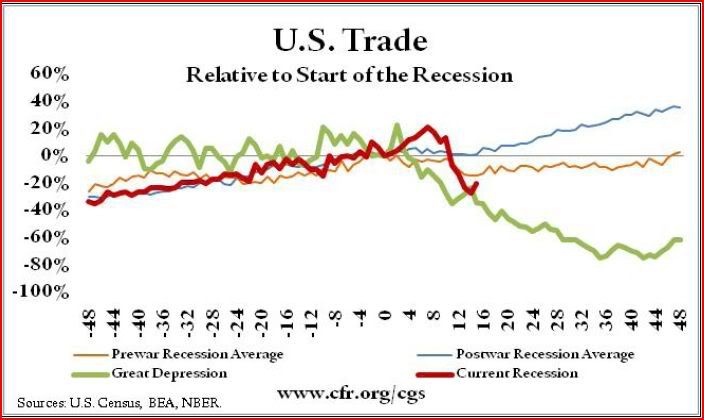
...and for our trade with the rest of the world.

As mentioned above, we have managed to avoid deflation with our massive deficit spending, but that also means the prudent are being punished in order to bail out the debtors.

Meanwhile the crash in home prices puts the Great Depression experience to shame. The consequences of this cannot be understated.
Finally we have unemployment. The common refrain from the Green Shooters is that the unemployment rate isn't nearly as bad as during the Great Depression, when unemployment hit 25%.
While technically true, it is also dishonest for two reasons.
#1) Unemployment didn't suddenly jump up to 25% overnight. It took four years to get there.
If you start counting from April 2008 (around the time that Bear Stearns went under), like most of the charts above do, then we are only 14 months into this Depression. The equivalent period of time during the Great Depression would take you to the fall of 1930.
So what was the unemployment rate in 1930? 8.7% What is the unemployment rate today? 9.4%
#2) The unemployment rate was measured differently during the Great Depression. For instance, there was no "discouraged workers" category. You were either employed, or not employed. You didn't fall out of the ranks of the unemployed because you didn't send someone a resume that week. Thus the unemployment numbers of today will understate real unemployment in a way that they wouldn't during the Great Depression.
