This is the next in a series of diaries on the state of Arctic sea ice (and other topics as warranted) in memory of Johnny Rook, who passed away in early 2009. He was the author of the Climaticide Chronicles.
This diary will be relatively short; not the Climate Change News Digest, but just news from the Arctic last week. Headlines:
- Ice extent increased more slowly than usual last week.
- The general circulation set up in something like what's called a positive Arctic Oscillation, with stronger-than-normal cyclonic circulation at high latitudes, and higher than normal pressures toward the south.
- Sea ice extent is less than it was after the record melt of 2007.
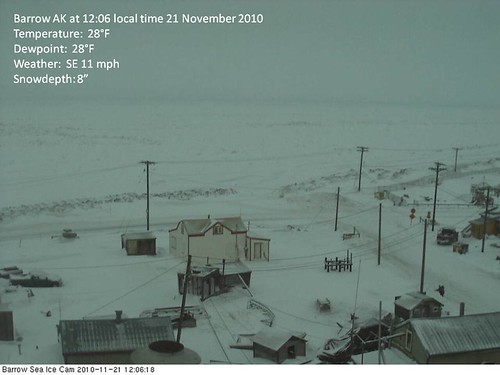
Here's a picture of the scene from the Barrow AK Arctic sea ice web camera taken last weekend.
More below the fold.
Climate of last week in the Arctic
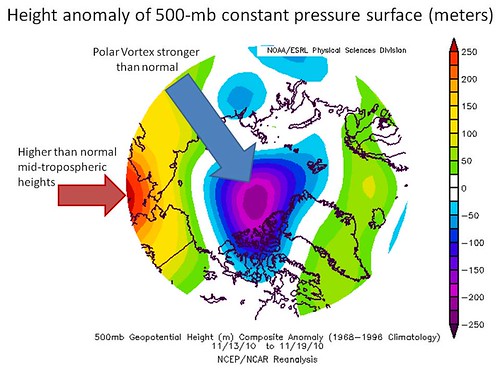
Last week, the Arctic reverted temporarily into a flow pattern, at least at the middle levels of the atmosphere, with a stronger than normal polar vortex over the Arctic Ocean north of the Canadian Archipelago. Higher than normal heights were south of this area, particularly over the Pacific Ocean and eastern Asia, and to a lesser extent in the far North Atlantic from Scandinavia across southern Greenland to Labrador in Canada. This is the positive phase of what is known as the Arctic Oscillation, and under such flow regimes, cold air tends to get locked up in the polar latitudes. Mild weather exists at middle latitudes, particularly where heights and pressures are above normal.
500 hPa (middle troposphere) Height Anomalies, 13-19 Nov 2010
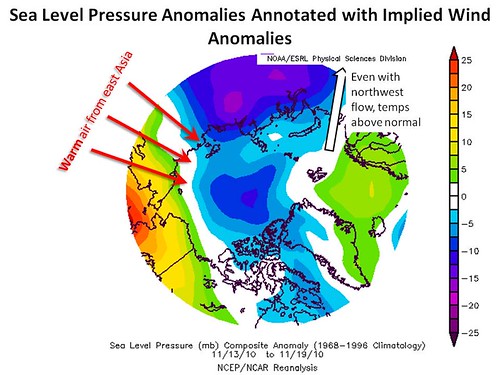
The sea level pressure anomalies for last week, associated with the mid-troposphere pattern showed high pressure from western North America and Alaska over the North Pacific and westward into eastern Siberia. Very strong low sea level pressure was over central Siberia, with warm winds from east and central Asia blowing into Arctic latitudes. Sea level pressure anomalies were below normal also over the Arctic Ocean and southward into northeastern Canada, though not as strong as those over central Siberia. Stronger than normal northwest winds were found at the surface into European Russia.
Sea Level Pressure Anomalies with Implied Surface Wind Anomalies, 13-19 Nov 2010
What temperature anomalies were associated with the sea level patterns? Temperatures at 3,000 feet above sea level (925-hPa) for 13-19 November are shown below.
925-hPa (3,000' above sea level) Temperature Anomalies, 13-19 Nov 2010
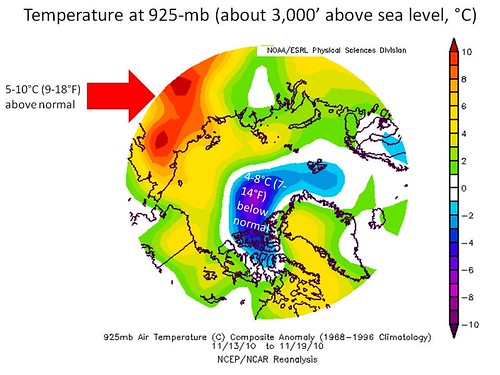
Colder than normal temperatures were found near the polar vortex over the Arctic Ocean and northern Canada (4-8°C, or 7-14°F below normal). An extensive area of above normal temperatures were found over most of the rest of the region north of 60°N latitude; it was as much as 10-18°F above normal in eastern Siberia where those strong southerly winds were located. Even in eastern Europe and European Russia, where winds were from polar latitudes, temperatures were still above normal. This is probably because of the lack of sea ice north of Europe, so that the air had no opportunity to cool as it flowed from the far north Atlantic into this area.
November in Alaska so far has been pretty much universally warmer than normal. Fairbanks and the rest of central Alaska just went through one of their worst ice storms in history, with very warm air overrunning cooler air (but hardly cold, with temperatures more than 30°F above normal, but with the ground still below freezing) resulting in lots of glaze, from half an inch to one inch thick. Temperatures in Fairbanks and Barrow thus far this month have run 10°F or more above normal.
21-22 November 2010 Arctic sea ice conditions
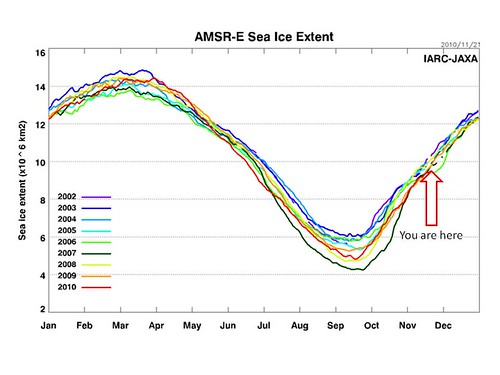
Arctic sea ice extent continues below normal, and the rate of increase has been less than normal. The graphic below shows the annual cycle of Arctic sea ice extent for 2002 through 2009, and 1 January through 22 November 2010.
International Arctic Research Center (IARC) Time Series of Arctic Sea Ice Extent, 2002 through 22 November 2010
The map of the Arctic sea ice extent below has the 1979-2000 mean Arctic sea ice extent marked with an orange contour, with the 21 November 2010 extent in white. The extent is defined as the area with sea ice concentration of 15% ice coverage or more.
National Snow and Ice Data Center (NSIDC) 21 November 2010 Arctic Sea Ice Extent
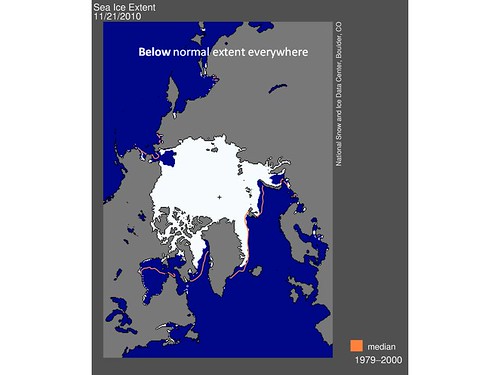
Almost the entire Arctic has below normal sea ice extent, especially the Bering and Beaufort Seas between Alaska and Siberia, and the Hudson Bay, which as of 21 November was essentially ice free. Ice extent was also below normal in the Davis Strait between Greenland and Canada.
NOTE: Since 21 November, ice extent has continued to grow only slowly, according to the NSIDC and the IARC. The IARC has a sea ice extent value for 24 November 2010 of 9,597,656 km2, the second lowest of the 2002-2010 series. Only 24 November 2006, the year preceding the record low sea ice minimum in September 2007, had a lower sea ice extent.
That's all folks ... I'll be doing the next Climate Change News Roundup this coming weekend, FSM/God/higher power willing.
