This is the next in an occasional series of diaries on the state of Northern Hemisphere Arctic sea ice (and other topics as warranted), written in memory of Johnny Rook, who passed away in early 2009. He was the author of the Climaticide Chronicles.
Headlines:
- The decrease noted in sea ice melt noted in the last few diaries continued last week.
- Record heat has been going on across Russia and Siberia for the last week; readings in the 90s°F in northeastern Siberia were noted yesterday afternoon local time (map below the fold
- The Arctic Ocean basin has been rather cool over the past week, particularly on the North American and Asian side.
More after the jump.
Conditions since last week
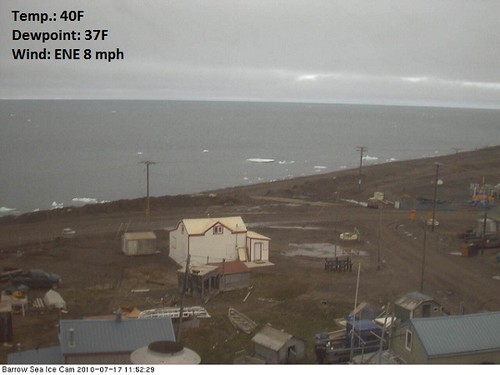
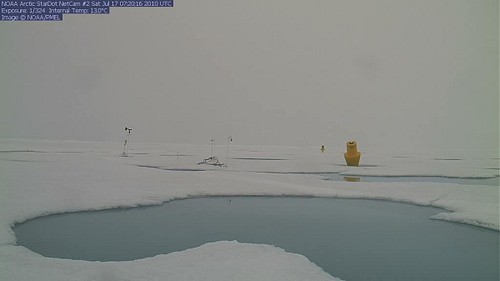
Below are two web cam pictures: The first from Barrow AK's Arctic sea ice camera, the second from the NOAA2 web cam. Note the clouds. Weather conditions at Barrow are added to its picture.
Barrow AK web cam, 17 July 2010 11:52 Alaska Time
NOAA2 web cam, 17 July 2010 7:20 Universal Time
The figure below shows the time series of Arctic sea ice extent from 1 April through 31 August for the long-term mean (1979-2000, bold black), the long-term variability (95% of 1979-2000 extent measurements inside the gray shading surrounding the long-term mean), the 2007 Arctic sea ice extent (the year of the record minimum, dark green dash), and this year through 16 July 2010 (solid blue). You can see that loss of sea ice extent slowed considerably at the end of June after record large losses and a record low monthly mean sea ice extent for June 2010.
1 April Through 31 August Time Series of Arctic Sea Ice Extent
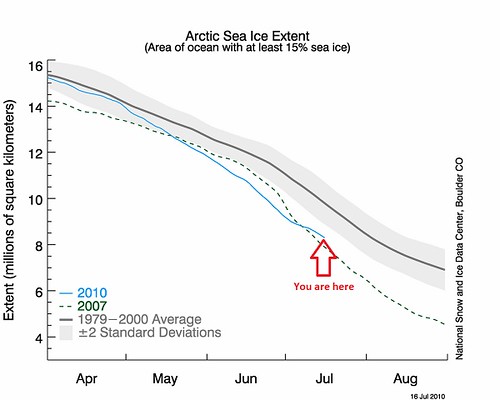
There is some indication that sea ice loss has sped up a bit in the last few days. This is indicated by the slight steepening of the slope of the blue line within the last few days. (NOTE: Just checked the NSIDC site now, and the 17 July 2010 time series image is up. The time series of sea ice extent for this year continues to steepen.)
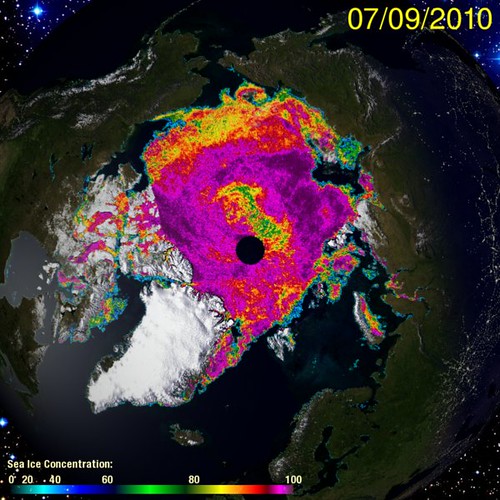
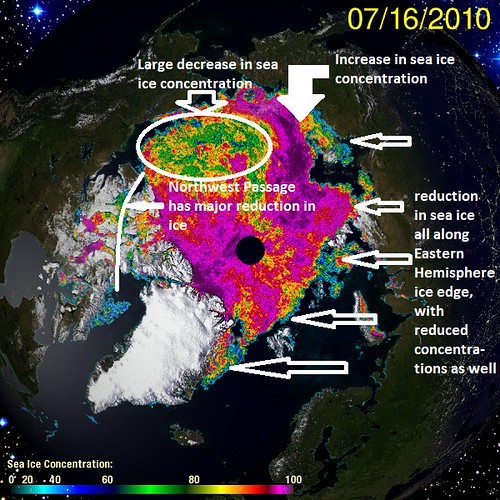
How does the latest sea ice concentration map compare to a week ago? The images below show 9 July versus 16 July 2010 Arctic sea ice concentrations according to remote sensing/satellite imagery from the Univ. of Illinois Urbana-Champagne Cryosphere Today web site. The 16 July 2010 image is annotated with changes that I saw when comparing the two.
Arctic sea ice concentrations (%): 9 July 2010
Arctic sea ice concentrations (%): 16 July 2010, annotated with weekly changes
If you want to see the satellite-derived changes in Arctic sea ice extent since early June, you can go to the CTanimate.arctic.color.0.html animation at the Cryosphere Today site. If you look carefully toward the end of the animation, you'll see the ice flow seemingly reverse direction. This is related to the wind anomalies I'll show below.
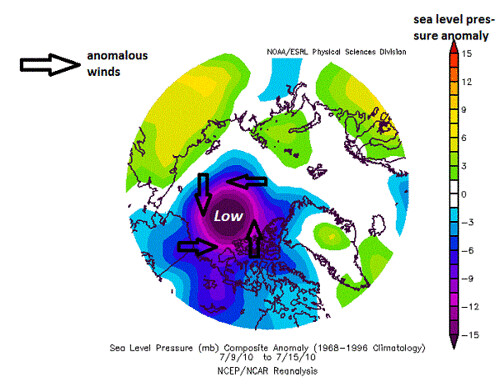
The sea level pressure and 925-mb (about 3000' above sea level) temperature anomalies for the week of 9-15 July 2010 are seen in the next panel. Note the counterclockwise wind anomalies I've indicated on the mean sea level pressure map. This is the same direction the sea ice in the Arctic Ocean north of Canada is now moving, according to the animation at Cryosphere Today.
Mean Sea Level Pressure Anomaly, week of 9-15 July 2010
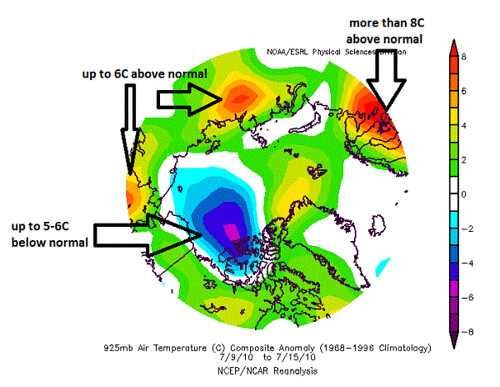
925-mb Temperature Anomaly, week of 9-15 July 2010
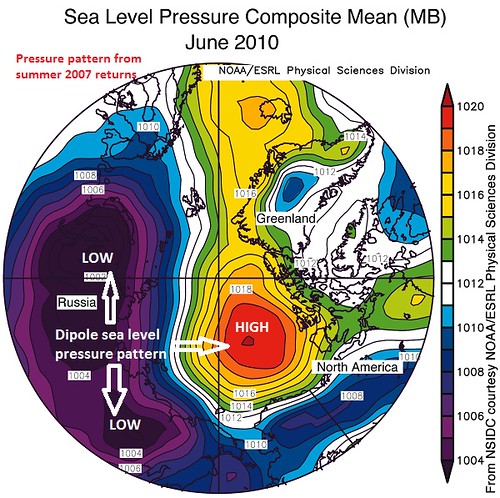
The anomalous winds may have contributed to "pulling" the ice apart and reducing concentration levels as the wind shifted 180° from the clockwise direction that it was moving in earlier, as we can see in the graphic below. Note the high pressure anomalies over the Arctic Ocean, where now there is a low pressure anomaly.
June 2010 Mean Sea Level Pressure Anomalies
Given the cooler than normal temperatures in the area, winds are more likely than temperatures to explain last week's reduction in sea ice concentration.
What's Next?
What's next very much depends on the temperatures and the near surface winds. This has been a mantra for those who predict the Arctic sea ice extent (or at least, it should be) in advance. One thing that can pretty certainly be stated regarding summer sea ice extent in the future; as long as the ice is largely only a year old or less and is thinning (see previous diaries on the sea ice thickness), the minimum sea ice extent will be very sensitive to temperature and wind anomalies.
As usual, stay tuned.
