This is the next in an occasional series of diaries on the state of Northern Hemisphere Arctic sea ice (and other topics as warranted), written in memory of Johnny Rook, who passed away in early 2009. He was the author of the Climaticide Chronicles.
HEADLINES:
- Steady decline in Arctic sea ice, about par with 1979-2000 average rate.
- National Snow and Ice Data Center post a press release on the slowdown in Arctic sea ice loss
- Pressure and wind anomalies make a warm Siberia and cold northeast Europe
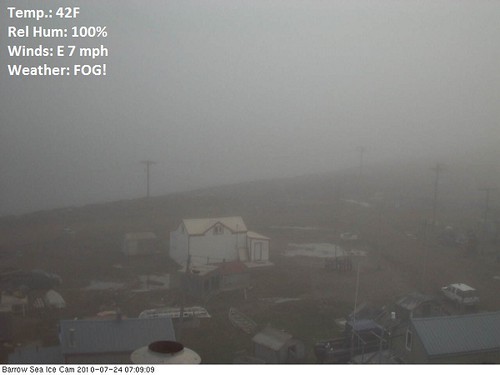
The obligatory Arctic web cam picture, this one from Barrow AK yesterday morning, is shown below.
Barrow AK in the Fog
Barrow AK at 7:09 a.m. Alaska Time, 24 July 2010
More after the fold.
Last week in the Arctic
The temperature and sea level pressure anomalies are shown in the two graphics below.
925-mb (above 3,000 ft. above sea level) Temperature Anomalies from 16-22 July 2010 In °C (1°C=1.8°F)

Mean Sea Level Pressure Anomalies (millibars or hPa) from 16-22 July 2010, with Wind Anomalies Annotated
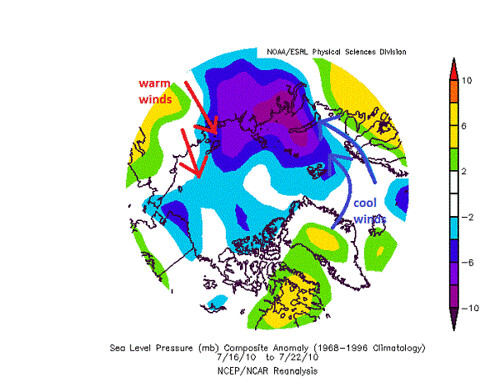
The cool weather over the Arctic basin from the previous week relaxed toward normal, though it was still somewhat cool, especially in the North America side of the basin. Siberia heated up considerably to as much as 12°C (22°F) and more above normal. This was the result of warm winds from the south in this area moving counterclockwise around stronger than normal low pressure over northwestern Siberia.
These anomalous winds also tended to push the sea ice away from the Siberian coast, as can be seen in the sea ice concentration graphic below, from 23 July 2010. I've annotated the graphic with changes over the previous one from 16 July.
23 July 2010 Arctic Sea Ice Concentrations from Cryosphere Today Website at Univ. of IL at Urbana-Champagne
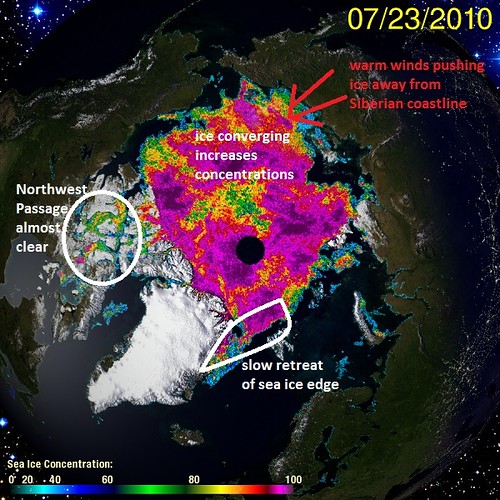
We note the ice moving away from Siberian Asia into the Arctic basin, resulting in a retreat of the ice edge from the Siberian coast and an increase in sea ice concentration in the central Arctic basin because of wind-driven ice convergence. On the European side of the ice pack, slow and steady retreat has been occurring, while the Northwest Passage through the Canadian Archipelago continues to clear of ice as temperatures have mostly been above normal in this area almost the entire 2010 calendar year to date, including a record warm winter.
Current conditions
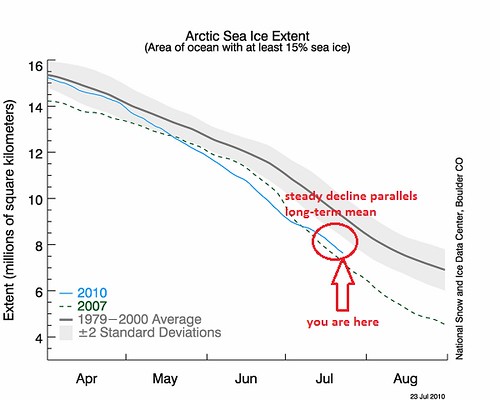
I have a couple of graphics below that describe the current state of the sea ice; one of sea ice areal extent and the other of sea ice volume (through 17 July 2010 from University of Washington).
Arctic Sea Ice Extent (15% coverage definition), 1 April through 31 August for 2007 and for 1979-2000 mean, through 23 July for 2010
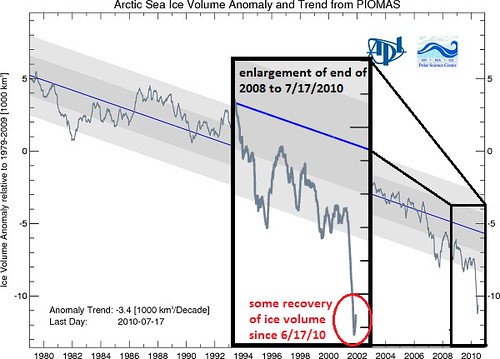
Arctic Sea Ice Volume from PIOMAS Data Assimilation System, 1979 to 17 July 2010
The sea ice extent has declined to about 7.5 million km2, which is the 1979-2000 normal for mid-August. It's declining at a rate of about 70-80,000 km2 per day over the past week, though another site with daily numbers seems to indicate that loss rates the last couple of days have been closer to 100,000 km2 per day.
The volume graphic is an update of one I and others (FoOW) have shown, based on a state-of-the-art sea ice model including a system by which available observations are assimilated to make sure the model doesn't go far astray. The most recent data is blown up to show that since the last update through 17 June, the sea ice volume anomaly has decreased, though still well below the linear trend line. As of 17 July 2010, sea ice volume lies in excess of 3 standard deviations below the linear trend line. There is a less-than 0.1% probability of this occurring if the linear trend line is the truth. The current value is 10,500 cubic kilometers below the normal for 17 July over the period from 1979-2009.
Recall this graphic of the seasonal cycle of sea ice volume from a previous diary.
Mean Annual Cycle of Arctic Sea Ice Volume, 1979-2009
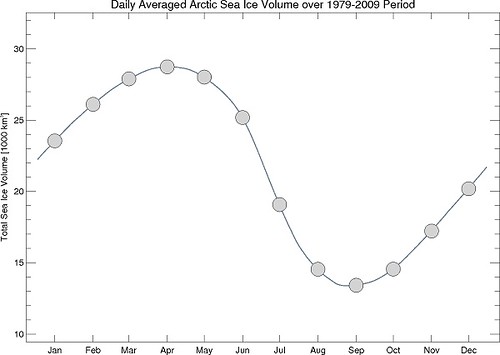
If we use the circle over the beginning of July as the mean monthly value, and 17 July as representative of the monthly mean for July of 2010, we see that the mean monthly July value is about 18,000 km3, so a negative anomaly of 10,500 km3 means that the actual volume is about 7,500 km3, or only about 42% of the normal volume. In June 2010, we were at about 50% of normal.
What's Next?
That will depend on what kind of circulation anomalies set up for the rest of the melt season, which ends in mid-to-late September most years. The deep low over western Siberia, were it to remain and if high pressure built to its east, would push the sea ice toward the middle of the Arctic Ocean, reducing the total areal coverage. If temperatures become warmer than normal over a large portion of the Arctic basin and skies become abnormally clear, then incoming solar radiation would be higher than normal as well, though this factor now is decreasing in importance as the angle of the sun above the horizon is decreasing as we inexorably head to northern winter.
As usual, stay tuned!
