This is the next in an occasional series of diaries on the state of Northern Hemisphere Arctic sea ice (and other topics as warranted), written in memory of Johnny Rook, who passed away in early 2009. He was the author of the Climaticide Chronicles.
The National Snow and Ice Data Center has just issued its June 2010 report, and it isn't pretty. Headlines:
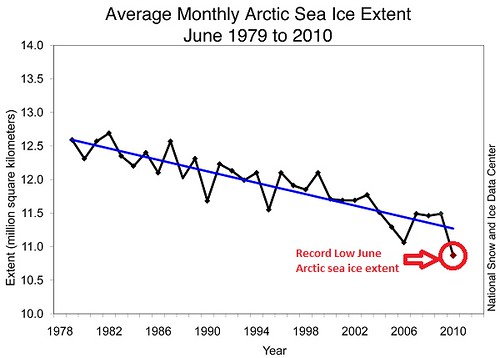
- Record low mean June Arctic sea ice extent
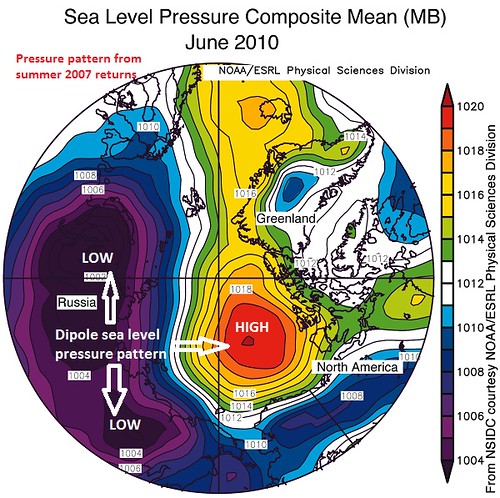
- A return of the sea level pressure and wind patterns that brought us the record Arctic sea ice minimum extent in September 2007
- Arctic sea ice loss may decrease for a time because of reaching thicker second- and third-year sea ice
Details below.
Causes of the June 2010 Arctic Sea Ice Decline
The mean June 2010 Arctic sea ice extent set a record low, as can be seen in the graphic below from the National Snow and Ice Data Center in Boulder CO.
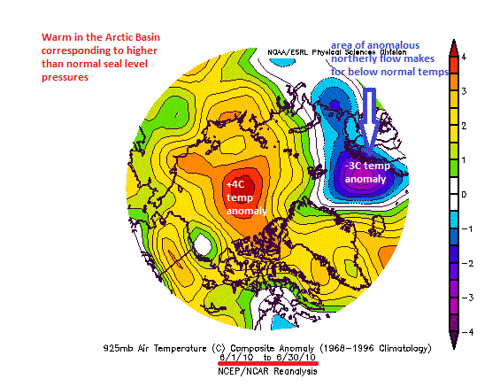
This was the result of high pressure over the Arctic basin and lots of sun and export of ice southward from the northeast and northerly winds. Temperatures over the Arctic were warmer than normal as well, as I showed in last weekend's diary; graphic reproduced below.
Sea level pressure anomalies (below) were also reported on last week; what I didn't report is that these anomalies are similar to those that were seen in the record minimum sea ice extent year of 2007.
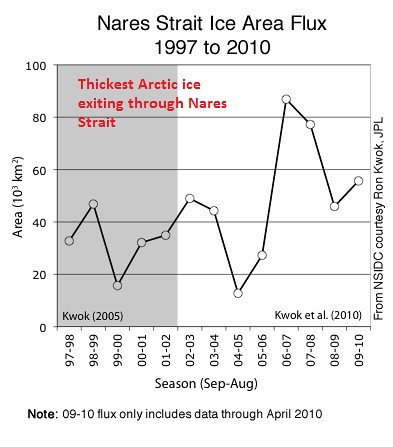
A larger than normal amount of thick old ice is exiting into the Davis Strait through what is called the Nares Strait, between Greenland and the Canadian Arctic archipelago; annotated satellite image of the area below.
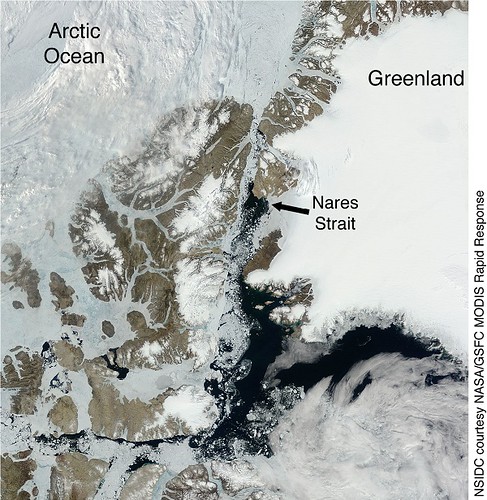
While the amount of sea ice involved is relatively small in area, it is probably the oldest sea ice in the basin, staying frozen because of its position up against the Greenland ice sheet. The graphic below shows the area of sea ice moving through the strait in 1,000s of km2. Doesn't seem like much, but one might consider this ice as something of an anchor.
What Will Likely Prevent a New Record Minimum this September
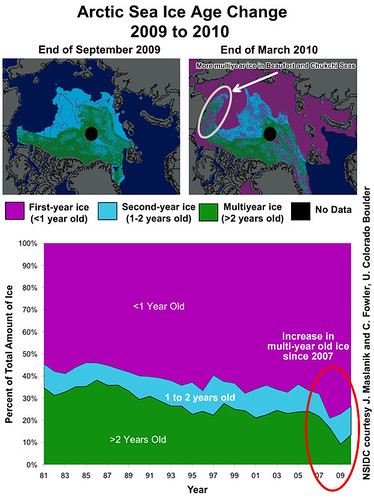
The graphic below shows the percentages of sea ice less than one year old, 1-2 years old, and 2 years old or greater. This has bearing on sea ice thickness, and thus how fast the ice will melt. Note that a good bit of the older sea ice was in the Beaufort and Chukchi Seas north of AK and northwest Canada.
Unless conditions remain favorable for melt, these regions will hold onto their ice longer than in recent years. In fact, these areas have seen slowing in their ice loss over the past week or two.
Hello, Antarctica
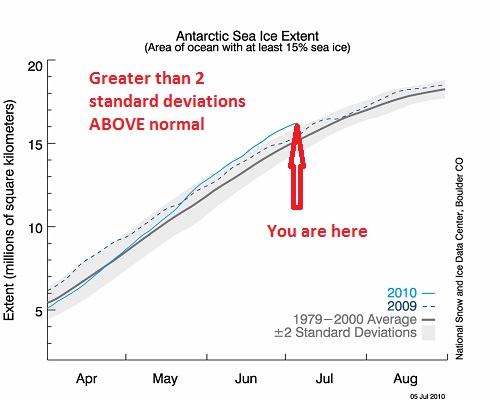
Meanwhile, the Antarctic has LOTS of ice. More than 2 standard deviations above the 1979-2000 mean Antarctic sea ice extent, in fact. This can be seen below.
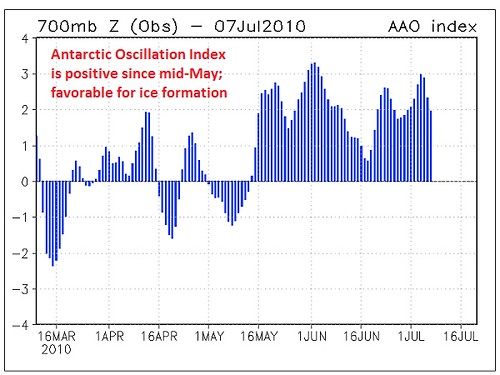
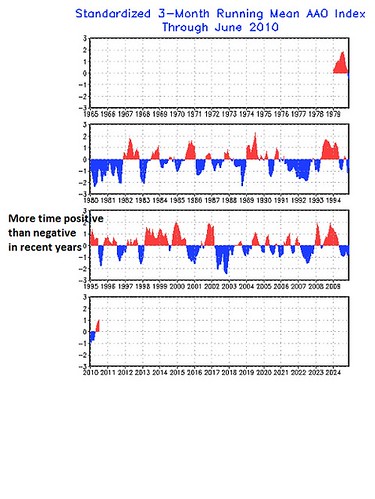
This can be attributed to what's known as the Antarctic Oscillation (AAO), a kind of variability that involves sea level pressure and wind anomalies seesawing between the Antarctic continent and the surrounding oceans. The difference in pressure between the continent and oceans is how this is measured. A positive value means unusually low pressure over the Antarctic and unusually high pressure equatorward from there, and stronger than normal westerly winds over the sea ice itself. A positive AAO is associated with greater than normal expansion of the Antarctic sea ice in the southern hemisphere cold season. The graphic below shows the trend in the AAO since early March 2010.
The positive AAO is associated with a stronger and colder than normal polar vortex over the Antarctic, and stormier than normal weather on the Antarctic coast and adjacent ocean waters/ice. This has been a common pattern in recent years, as can be seen in the graphic below showing the monthly mean AAO since 1979. It's believed to be associated with the peculiar geography of the Antarctic (land mass centered on the pole, rather than ocean covered seasonally with ice) and the loss of ozone, which acts as greenhouse gas at the temperatures typically seen on the elevated Antarctic ice sheet.
I'll be doing a report over the weekend ... we'll see whether the current slowdown in Arctic sea ice loss will continue.
UPDATE: Tip of the hat to Blue Aardvark:
Here's the mean annual cycle for 1979-2009 for the Arctic sea ice volume:
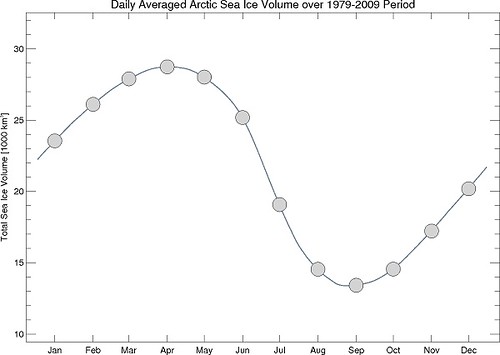
Current volume anomaly is -10,500 plus or minus a few 100 km3. That means, assuming the model used to create the volume time series is right, that we are 50% below normal ice volume on 18 June 2010. See University of Washington Arctic web site here.
