This is the next in a series of diaries on the state of Arctic sea ice (and other topics as warranted) in memory of Johnny Rook, who passed away in early 2009. He was the author of the Climaticide Chronicles.
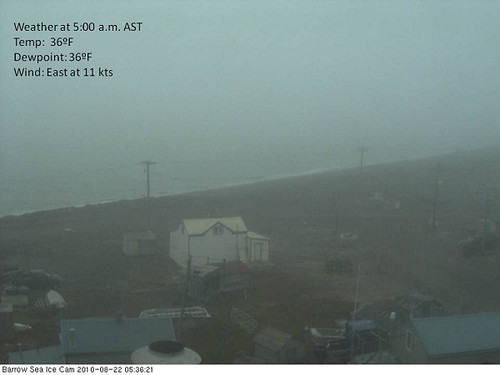
We're heading toward the end of the Arctic sea ice melt season as the sun descends toward the horizon in the polar latitudes. Speaking of polar latitudes, here's a picture from Barrow AK from yesterday morning, annotated with the weather at the time. Foggy and gloomy, par for the course in August.
Barrow AK web cam photo, 23 August 2010 at 5:36 a.m. Alaska Time
More below the fold.
Weather in the Arctic Last Week
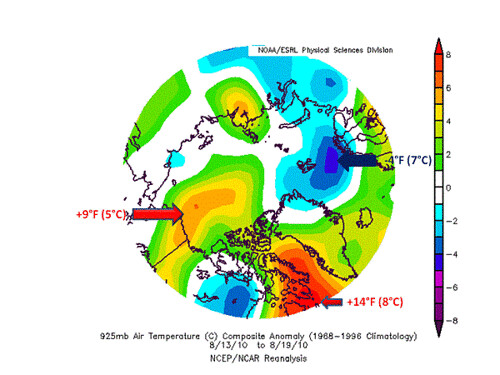
Looking at the temperature departures from normal ("anomalies") for the week ending 19 August 2010, we see that much of the Arctic basin had near to above normal temperatures, by as much as 14°F (8°C) in the Canadian Archipelago and Davis Strait between Canada and Greenland. It was colder than normal on the European side, mostly south of the ice pack, by as much as 7°F (4°C).
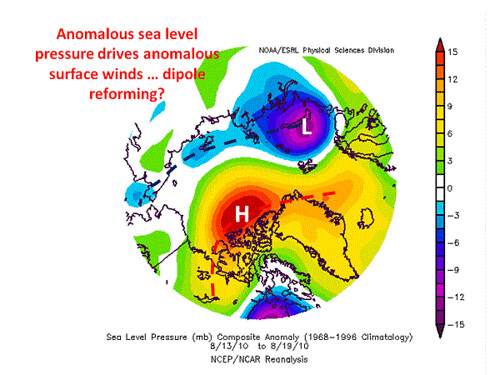
Next, in the mean sea level pressure for the past week, it appears that the new anomaly pattern known as the Arctic dipole returned. This pattern is marked by anomalously low pressure over the Asian side of the Arctic basin and anomalously high pressure over the North American/Greenland side. This impacted winds and temperature anomalies as well. Sea level pressure, wind, and temperature anomalies are shown in the next three graphics below.
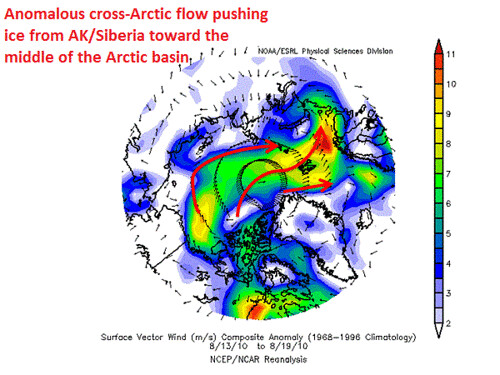
The wind anomaly arrows show the cross-Arctic flow going from Alaska and Siberia toward the Greenland and Europe. This has affected the motion and concentration of sea ice, as I'll show later.
Arctic 925-hPa Temperature Anomalies, 7 Days Ending 19 August 2010
Arctic Sea Level Pressure Anomalies, 7 Days Ending 19 August 2010
Arctic 10-meter Wind Anomalies, 7 Days Ending 19 August 2010
Arctic Sea Ice Response to Last Week's Weather
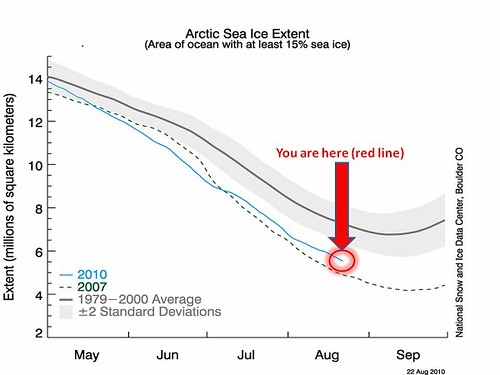
The extent of Arctic sea ice is defined as the area covered by 15% concentration or more of sea ice in the northern oceans. Below is a graphic from the National Snow and Ice Data Center (NSIDC) for Arctic sea ice extent from May 1 through September 30 for the long term mean (bold, with 95% probability bands to either side), for 2007 in dash, and for this year through 22 August.
Arctic Sea Ice Extent from National Snow and Ice Data Center, 1 May through 30 September (bold, 1979-2000 mean; 2007 dashed; 2010 solid
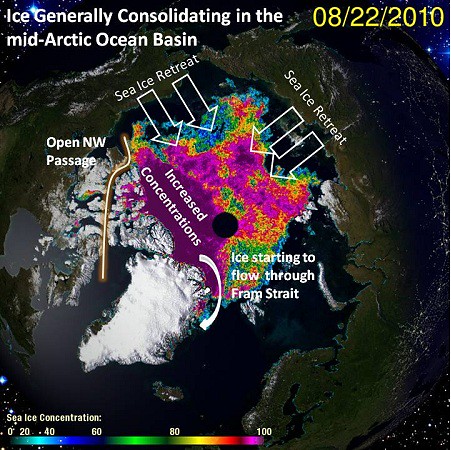
Concentrations are shown next, with annotations showing movement and retreat of the ice. Note how the motion and retreat has largely been forced by the winds pushing the ice toward the Greenland/North American side of the basin.
Arctic Sea Ice Concentrations, 22 August 2010
Where to Next?
The end of the melt season will occur in the next two to four weeks. The areal extent of sea ice today, 25 August 2010, was 5,511,250 km2; this is the third lowest value since 2002 with only 2007 and 2008 lower. This is all the more impressive given the late start to the melt season, with the sea ice maximum occurring during a cold spell at the end of March of 2010. I expect with the current flow regime, which is pushing ice from Siberia and Alaska into the central Arctic Ocean, that we'll be ending up with the 3rd lowest sea ice minimum over the historical record in 2010.
Other News
In brief:
- The historic Russian heat wave came to an end
- Palestine reported the warmest temperature ever at 51.4°C (124.5°F) verified from 7 August
- 18 countries have set highest temperatures ever recorded (historically at least) this year so far
- Atlantic hurricane season is becoming much more active, with 2 tropical systems of the Cape Verde/African variety in the eastern Atlantic presently ... Danielle (Cat 2 hurricane) and Earl (40 kt tropical storm). Both are expected to strengthen further.
