This is the next in a series of diaries on the state of Arctic sea ice (and other topics as warranted) in memory of Johnny Rook, who passed away in early 2009. He was the author of the Climaticide Chronicles.
Arctic sea ice is in the forefront of the news I have today. But I also have a graphic of the globally integrated near-surface temperature to show you all below.
Global Mean Temperature Time Series from U of Alabama Huntsville, 1998-2010
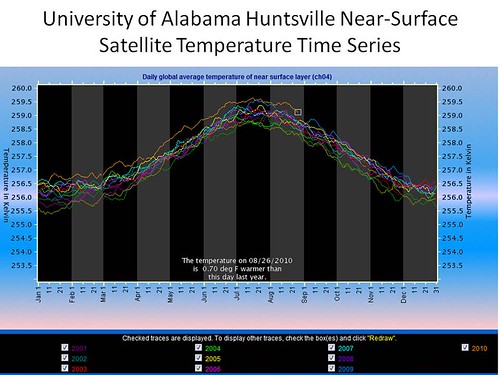
All but a few days in July have been warmer in 2010 than any of the previous 12 years. This is something not at all surprising given the kind of climate year we've had to date. That this is the case as we have transitioned to a La Niña from an El Niño in the last few months, however, may well be unprecedented.
More below.
Arctic Weather Conditions: Week of 20-26 August 2010
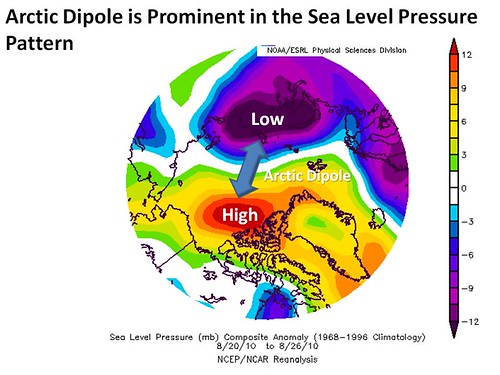
The Arctic Dipole was well-established during the week of 20-26 August 2010. Mean sea level pressure was well below normal over the arctic latitudes of the Asian continent (well in excess of 12-mb below), while pressure over the Canadian Archipelago and arctic North America was more than 12-mb above normal. This resulted in a strong, persistent cross-Arctic flow from the Bering Sea across the central Arctic Ocean to the European side of the Arctic. As has been noted before, this is also the pattern that persisted all summer during the record low Arctic sea ice minimum year of 2007. The graphic below shows this sea level pressure pattern.
Mean Sea Level Pressure Anomalies, 20-26 August 2010
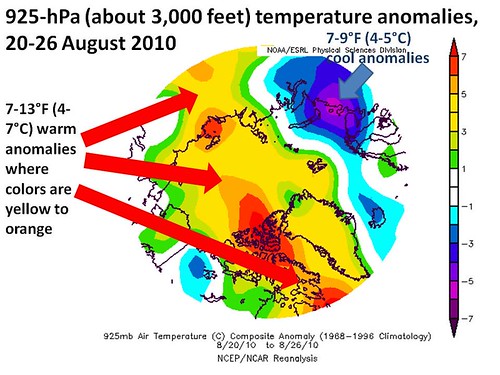
As seen in the following graphic, temperatures were also above normal over much of the Arctic, especially those areas with southerly flow from the mid-latitudes. That would be the Beaufort and Chukchi Seas and the Canadian Archipelago regions where temperatures were as much as 13°F (7°C) above normal. The warmer than normal temperatures extended past the North Pole into the European Arctic. Closer to Europe, it was colder than normal however, by as much as 7-9°F (4-5°C).
Mean 925-hPa (about 3,000 feet above sea level) Temperature Anomalies, 20-26 August 2010
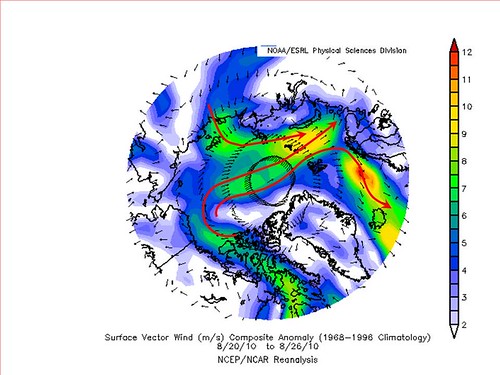
The result of the strong Arctic Dipole were very unusual surface winds as well, as shown in the next graphic. Surface winds were as much as 17 mph (7.5 ms-1) above normal from the south in the Arctic poleward of North America and eastern Siberia. This pushed warm air into these area and, beside melting the ice, pushed the ice away from the coastlines and reducing areal coverage. Winds were as much as 24-26 mph (12 ms-1) above normal in the northerly flow on the other side of the Arctic basin, pushing ice out from the Arctic basin into the seas north of Scandinavia.
Mean 10-meter Wind Anomalies, 20-26 August 2010
In summary, weather conditions were just about optimal for reducing sea ice area by both melting and by concentrating the ice during the past week.
Arctic Sea Ice Conditions Now
As of yesterday, 28 August 2010, the Japan Aeronautical Exploration Agency (JAXA) time series of Arctic sea ice extent showed a concentration of 5,342,656 km2, a decrease of over 360,000 km2 over the past 7 days. The graphic below, with the time series of 2002-09 for comparison, tells the tale. Where we were yesterday is highlighted.
Time Series of Arctic Sea Ice Extent, 2002-2010
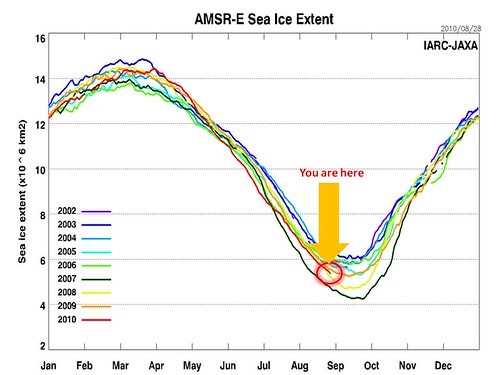
The current areal coverage is only about 93,000 km2 above the minimum from last year, which we should easily exceed this week. That will place this year's sea ice extent at 3rd lowest since 1979. It's unlikely we'll drop below 5,000,000 km2, thus also unlikely that we'd be able to drop below either 2008 or 2007, which had minima in the upper and low 4,000,000's km2, respectively.
The sea ice concentration (% coverage of water by sea ice) from 28 August 2010 is shown in the next graphic, annotated with changes since 21 August. The wind effects can easily be seen in the retreat of the ice from Alaska and Siberia and a slight push equatorward in the European sector. Concentrations increased north of North America while they decreased most other places, especially in the central Arctic basin north of central Asia.
Minimum Sea Ice Extent is Coming
The average date for the minimum coverage of sea ice is typically in mid-September, though it has a range of plus/minus 10 days to 2 weeks either side of that. It's possible that if the current weather pattern persists for a few more weeks, that we'll wind up below 5,000,000 km2. The 2008 sea ice minimum was 4,707,813 km2 on 9 September. That's over 600,000 km2 below the current value. As I said above, it seems highly improbable that we will reach that value, or anything close to it.
The Polar Science Center at the University of Washington has updated its Arctic Sea Ice Volume model through 16 August 2010.
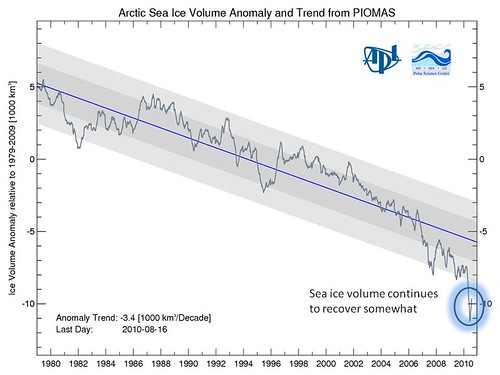
The negative anomaly at that time was about 9,600 km3 (cubic km), meaning the actual sea ice volume was about 5,100 km2, or about 30% of normal. As we approach zero, the absolute size of the anomaly in volume will become smaller and smaller, even as the percent below normal increases. So don't be fooled by that uptick in the graphic. I'll calculate the percentage of normal for you.
30% of the normal volume of ice. Scary. Almost as scary as a Glenn Beck rally.
