This is the next in a series of diaries on the state of Arctic sea ice (and other topics as warranted) in memory of Johnny Rook, who passed away in early 2009. He was the author of the Climaticide Chronicles.
Arctic sea ice reached its minimum extent (the area covered 15% or more sea ice) last week on 18 September 2010, according to the International Arctic Research Center (IARC) at University of Alaska Fairbanks. Since the minimum, sea ice extent in the Arctic Basin has increased by almost 300,000 km2 to about 5.1 million km2 as of 24 September.
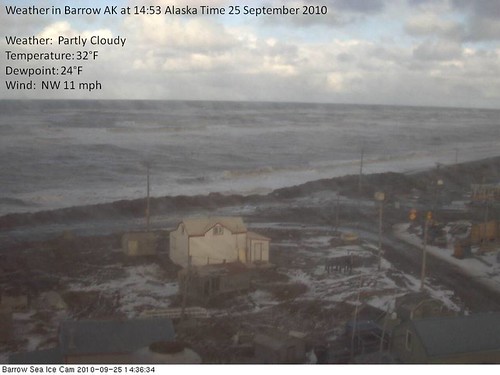
Here's a the Barrow AK Arctic Sea Ice webcam at 14:36 Alaska Time on 25 September. There's a trace of snow on the ground, but no sea ice as yet. Conditions at photo time are annotated.
More below.
About that Sea Ice Minimum
The Arctic sea ice extent minimum had been tentatively called at 10 September 2010 by the National Snow and Ice Data Center NSIDC, in a press release on 15 September. There had been three subsequent consecutive days of increases after the 10 September low value. But the Arctic atmosphere moved into a regime favorable for decreases, as I reported last week, and the final minimum value was over 100,000 km2 less than the 10 September value, and came pretty close to the 2008 value of 2nd lowest in the satellite record.
This has happened in other years. For example, in 2005, it appeared that an early minimum was reached at the end of August, but then values dropped from early September until almost the end of the month (2005 has the 5th lowest sea ice extent on record). I would expect that increases in the Arctic sea ice extent will be pretty large, as the surface over large areas begins refreezing at once. There is still a significant amount of warmer-than-normal water around the ice pack, however, which may delay refreeze if conditions are not conducive to rapid cooling.
Weather Conditions over the Arctic: Week of 17-23 Sept. 2010
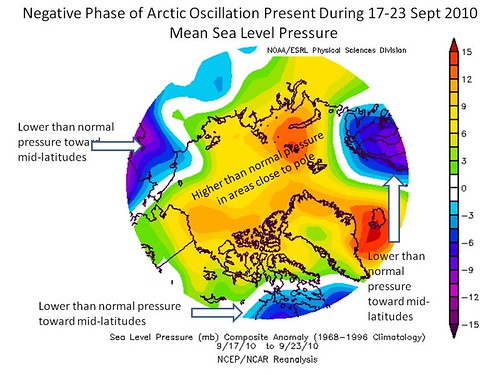
Over the past week, the sea level pressure pattern finally switched from the Arctic Dipole (unusually low pressure over Siberia, unusually high pressure over the North American Arctic and Greenland) to a pattern resembling the Arctic Oscillation in its negative phase (graphic below). In the Arctic Oscillation's negative phase, pressures are higher than normal in the Arctic basin, and lower than normal over the continents to the south.
Mean Sea Level Pressure Departures from Normal: 17-23 Sep 2010
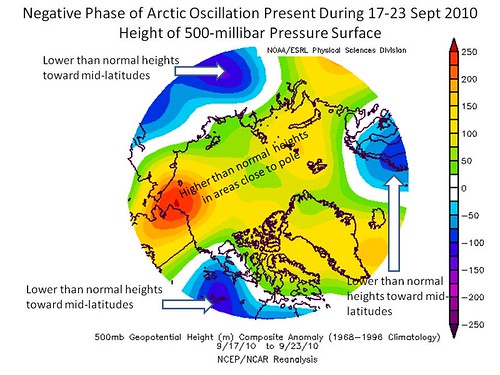
This pressure pattern extends upward into the mid-troposphere as well, as can be seen in the pattern for height anomalies for the 500-millibar pressure surface. Note the higher heights than normal over the Arctic; this indicates that higher than normal pressures exist through a depth at least halfway up into the atmosphere.
Mean 500-millibar Pressure Surface Height Departures from Normal: 17-23 Sep 2010
This pattern persisted much of last winter in the Northern Hemisphere. The result was temperatures warmer than normal in the Arctic and colder than normal at mid-latitudes, as people in the U.S. and Europe can attest. I had about 77" of snow last winter at my place in the Baltimore-Washington corridor, and the warmest it got in February was 45°F.
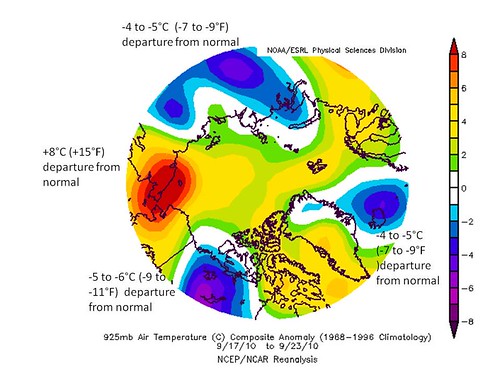
Temperatures at the 925 millbar level (about 3,000 feet above sea level) were above normal once again in much of the Arctic by as much as 8°C in northeast Siberia and the Bering Strait over to northwestern-most Alaska. It was colder than normal by as much as 6°C over northwest Canada and central Siberia; 5°C colder than normal near Iceland.
Mean 925-millibar Temperature Departures from Normal: 17-23 Sep 2010
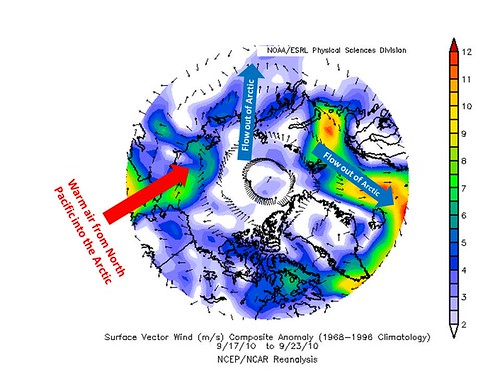
Surface wind anomalies were small last week, as would be expected with mean sea level pressures uniformly above normal over the Arctic Ocean. One exception was stronger-than-normal southerly winds in the Bering Sea between Alaska and Siberia, into the Arctic Ocean basin to the north. In many areas, winds were blowing out of the Arctic basin and into Siberia and the north Atlantic. Anomalous southerly and southeasterly winds could also be found in eastern Russia into the Arctic Ocean to its north, turning easterly north of Scandinavian Europe.
Mean Surface Vector Wind Departures from Normal: 17-23 Sep 2010
Condition of the Arctic Sea Ice at the End of the Week (23-25 Sep 2010)
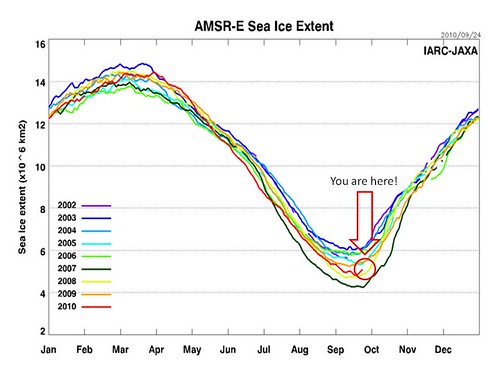
As I said above, in 2010 Arctic sea ice extent hit its minimum on 18 September. The time series of Arctic sea ice extent from calendar year 2002 through 2009, and the extent from 1 January through 24 September 2010 from the IARC/Japan Aeronautical Exploration Agency joint activity is shown below. The minimum can now be clearly seen in the 2010 time series.
IARC/JAXA Arctic Sea Ice Extent, 2002-2009 calendar years, 2010 through 24 September
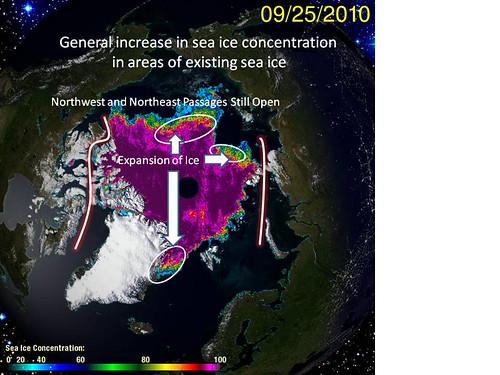
Arctic sea ice concentrations are also showing signs of refreeze recommencement. Sea ice has advanced equatorward in the central Arctic Ocean and on the northeastern side of Greenland. In general, sea ice concentrations have increased to 90% or greater over most of the area covered by sea ice as open leads have frozen over. The annotated graphic of all this from the University of Illinois Urbana-Champagne's (UIUC) Cryosphere Today website is shown below.
UIUC Cryosphere Today Arctic Sea Ice Concentration (%), 24 Sept 2010
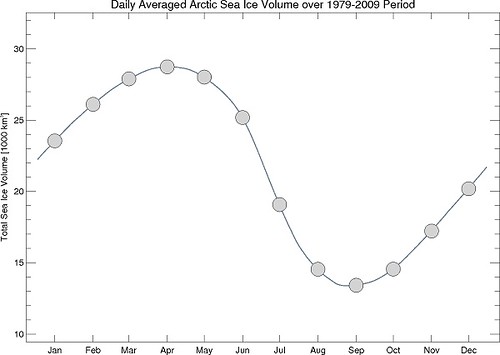
Finally, the University of Washington has published a more recent graphic of sea ice volume anomaly (difference from the −3,500 per decade trend) through 15 September 2010 from their PIOMAS model. As we've noted in previous diaries and others have commented, the volume is the most important parameter for sea ice. It indicates the amount of ice that must be melted to make the Arctic ice free. Below are both the time series of Arctic sea ice volume from 1979 through 15 September 2010 and the 1979-2009 annual cycle of sea ice volume.
Annual Cycle of Arctic Sea Ice Volume, Univ of Wash PIOMAS Model
PIOMAS Arctic Sea Ice Volume Anomaly from Linear Trend, 1979 through 15 September 2010
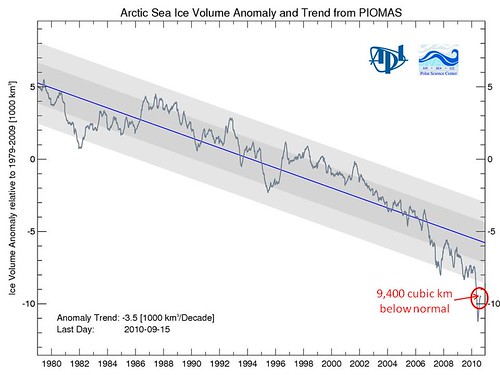
Note that the mean minimum sea ice volume in the annual cycle graph occurs in September, and is about 13,500 km3. So the anomaly of about 9,400 km3 means that the current ice volume is about 4,100 km3. This is only about 33% of normal. The other thing that's obvious from the sea ice volume time series is that over the past few years, the rate of decrease looks a great deal faster than linear. This has some climatologists concerned that we may be losing ice at a rate that will result in sea ice disappearance in summer as early as 2020.
The Refreeze Expectation
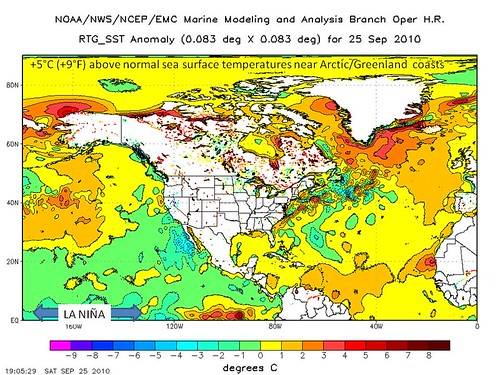
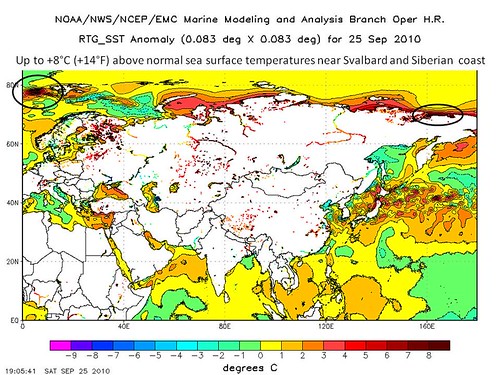
Sea surface temperatures (SSTs) along the Arctic coasts of North America, Asia, and Europe are generally above normal, as can be seen in the graphics below for the western and eastern hemispheres. The departures from normal have declined somewhat from last week, however.
Western Hemisphere Sea Surface Temperature Departures from Normal (°C), 25 Sept 2010
Eastern Hemisphere Sea Surface Temperature Departures from Normal (°C), 25 Sept 2010
Refreezing in recent years has occurred relatively rapidly. The only requirement is water temperature to reach -1.8°C (freezing point of sea water). Unless the weather becomes highly anomalous, this criterion is met pretty easily, especially with existing sea ice being able to "seed" the new ice.
I'll report on the monthly mean September sea ice extent in a couple of weeks. I won't be around next weekend and much of next week, because of being on a business trip.
